Outreach Toolkit > Infographics


On this page, you can find infographics developed by AIR and others, which highlight important findings from PIAAC.
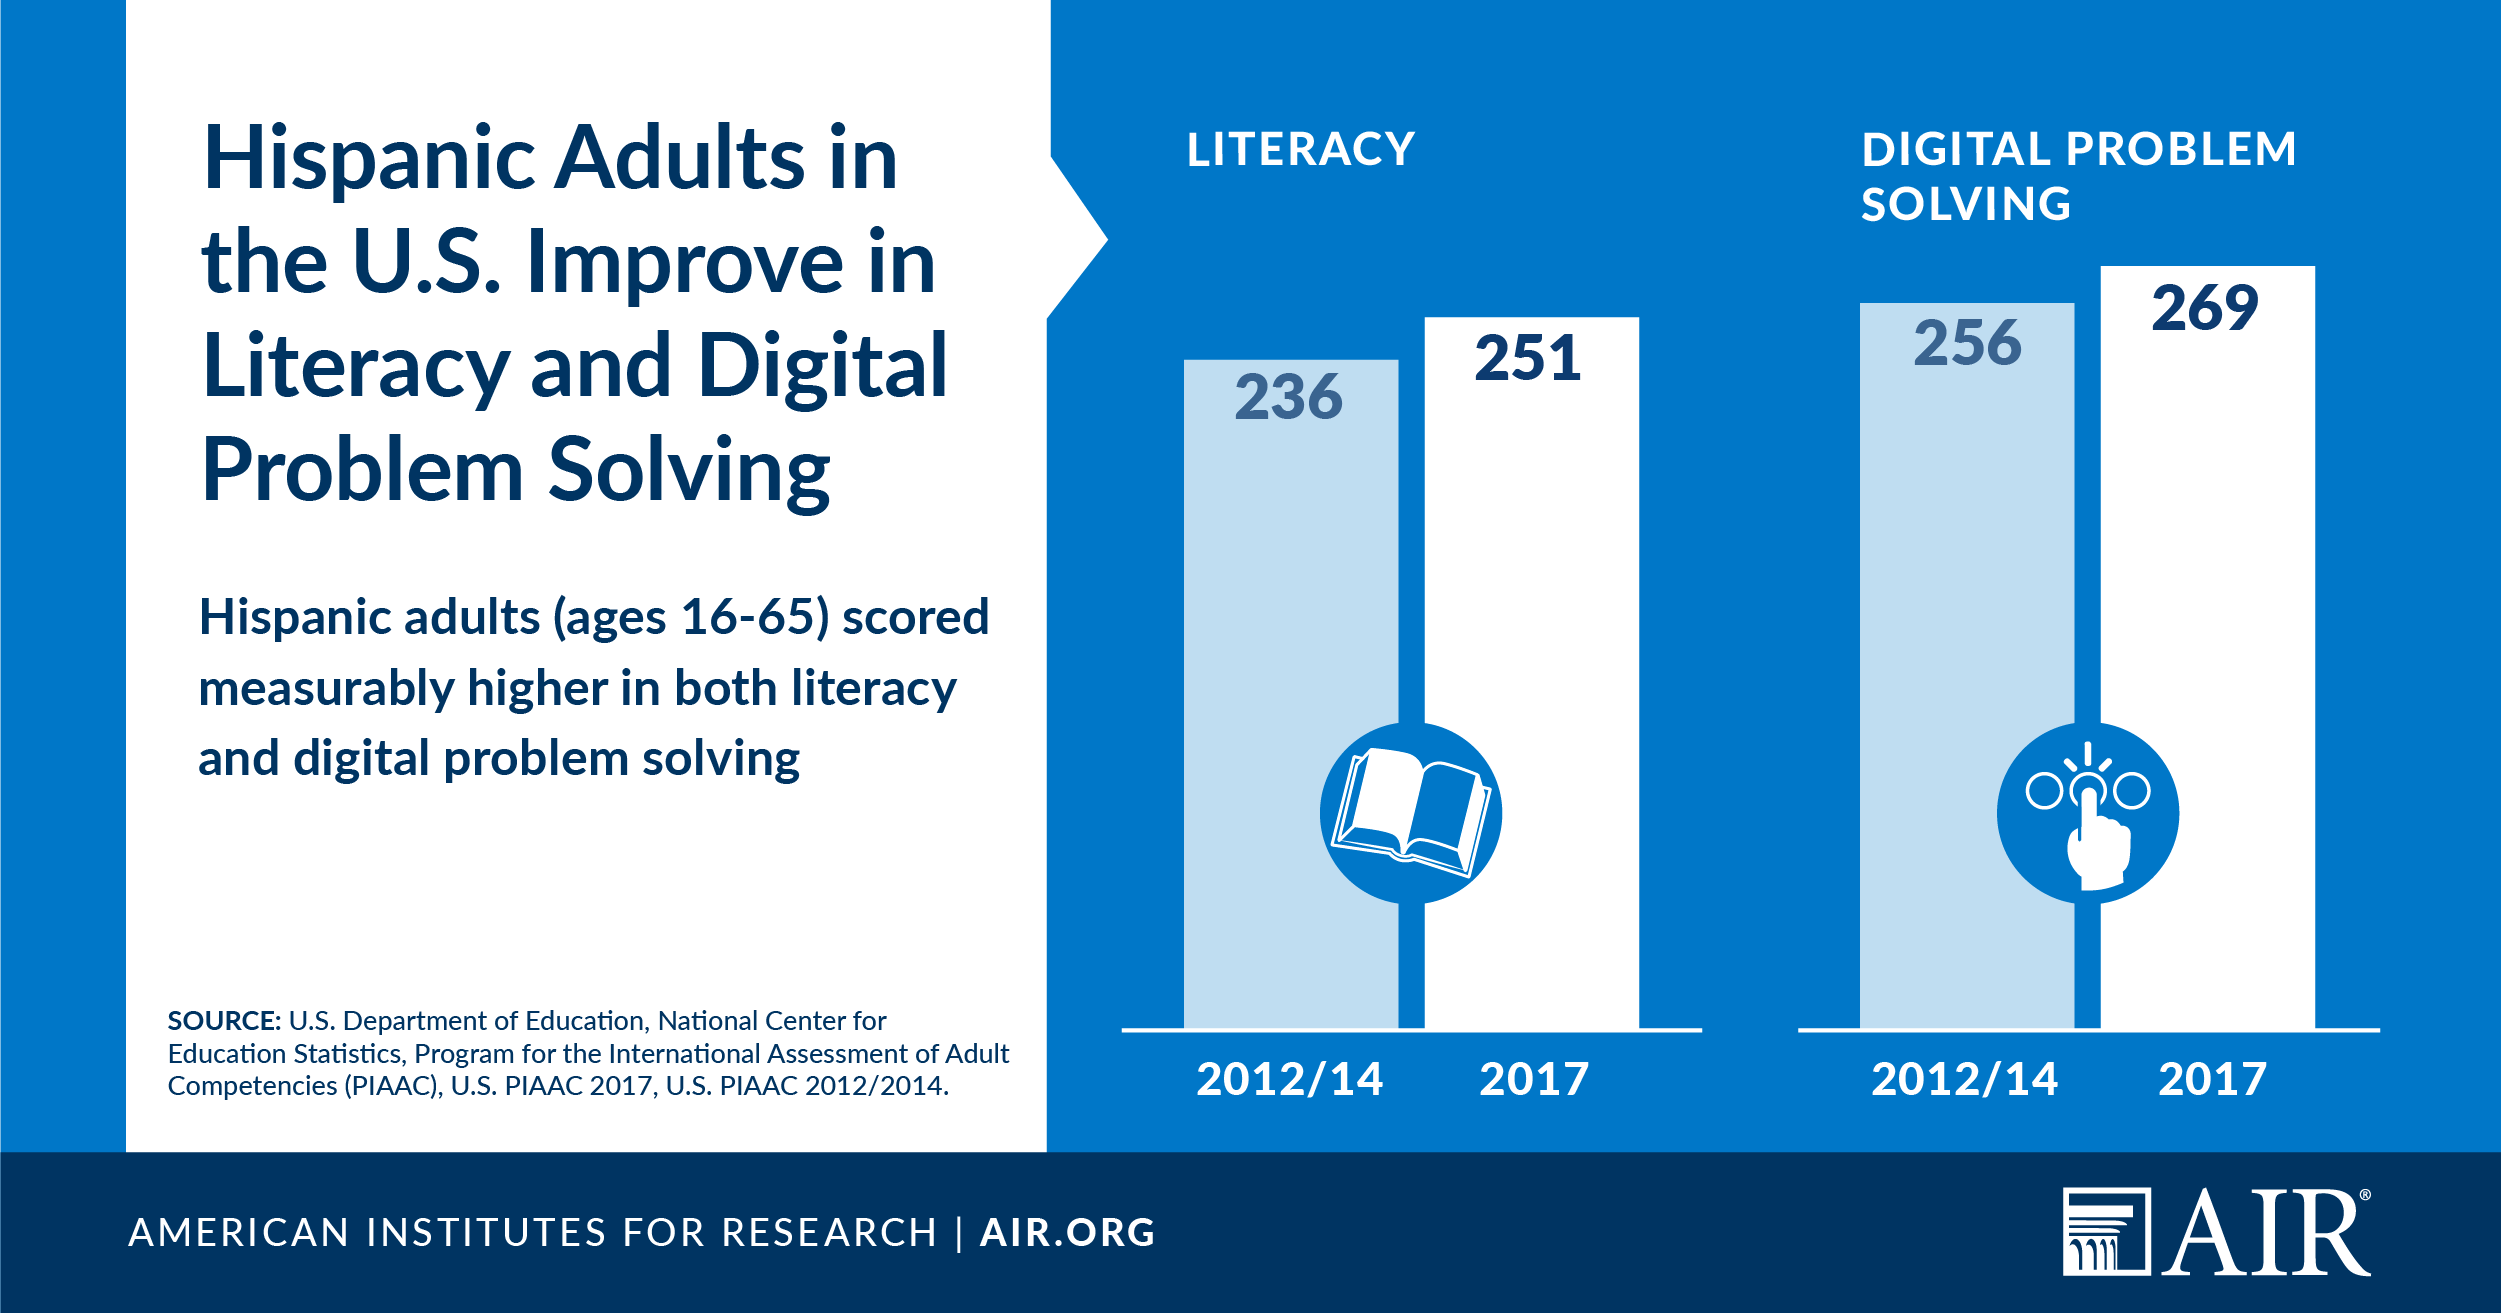
Hispanic Adults in the U.S.
This infographic, developed by AIR for Hispanic Heritage Month, highlights gains in literacy and digital problem-solving for Hispanic adults in the U.S.
Created with U.S. PIAAC 2012/2014 and 2017 data.
View as PDF ›
View as image file ›

Digital Literacy in the United States
This infographic was prepared by the AIR-PIAAC team for the blog highlighting the 2018 PIAAC Research-to-Practice Conference. It focuses on the digital literacy of U.S. adults.
Created with U.S. PIAAC 2012/2014 data.
View as PDF ›
View as image file ›
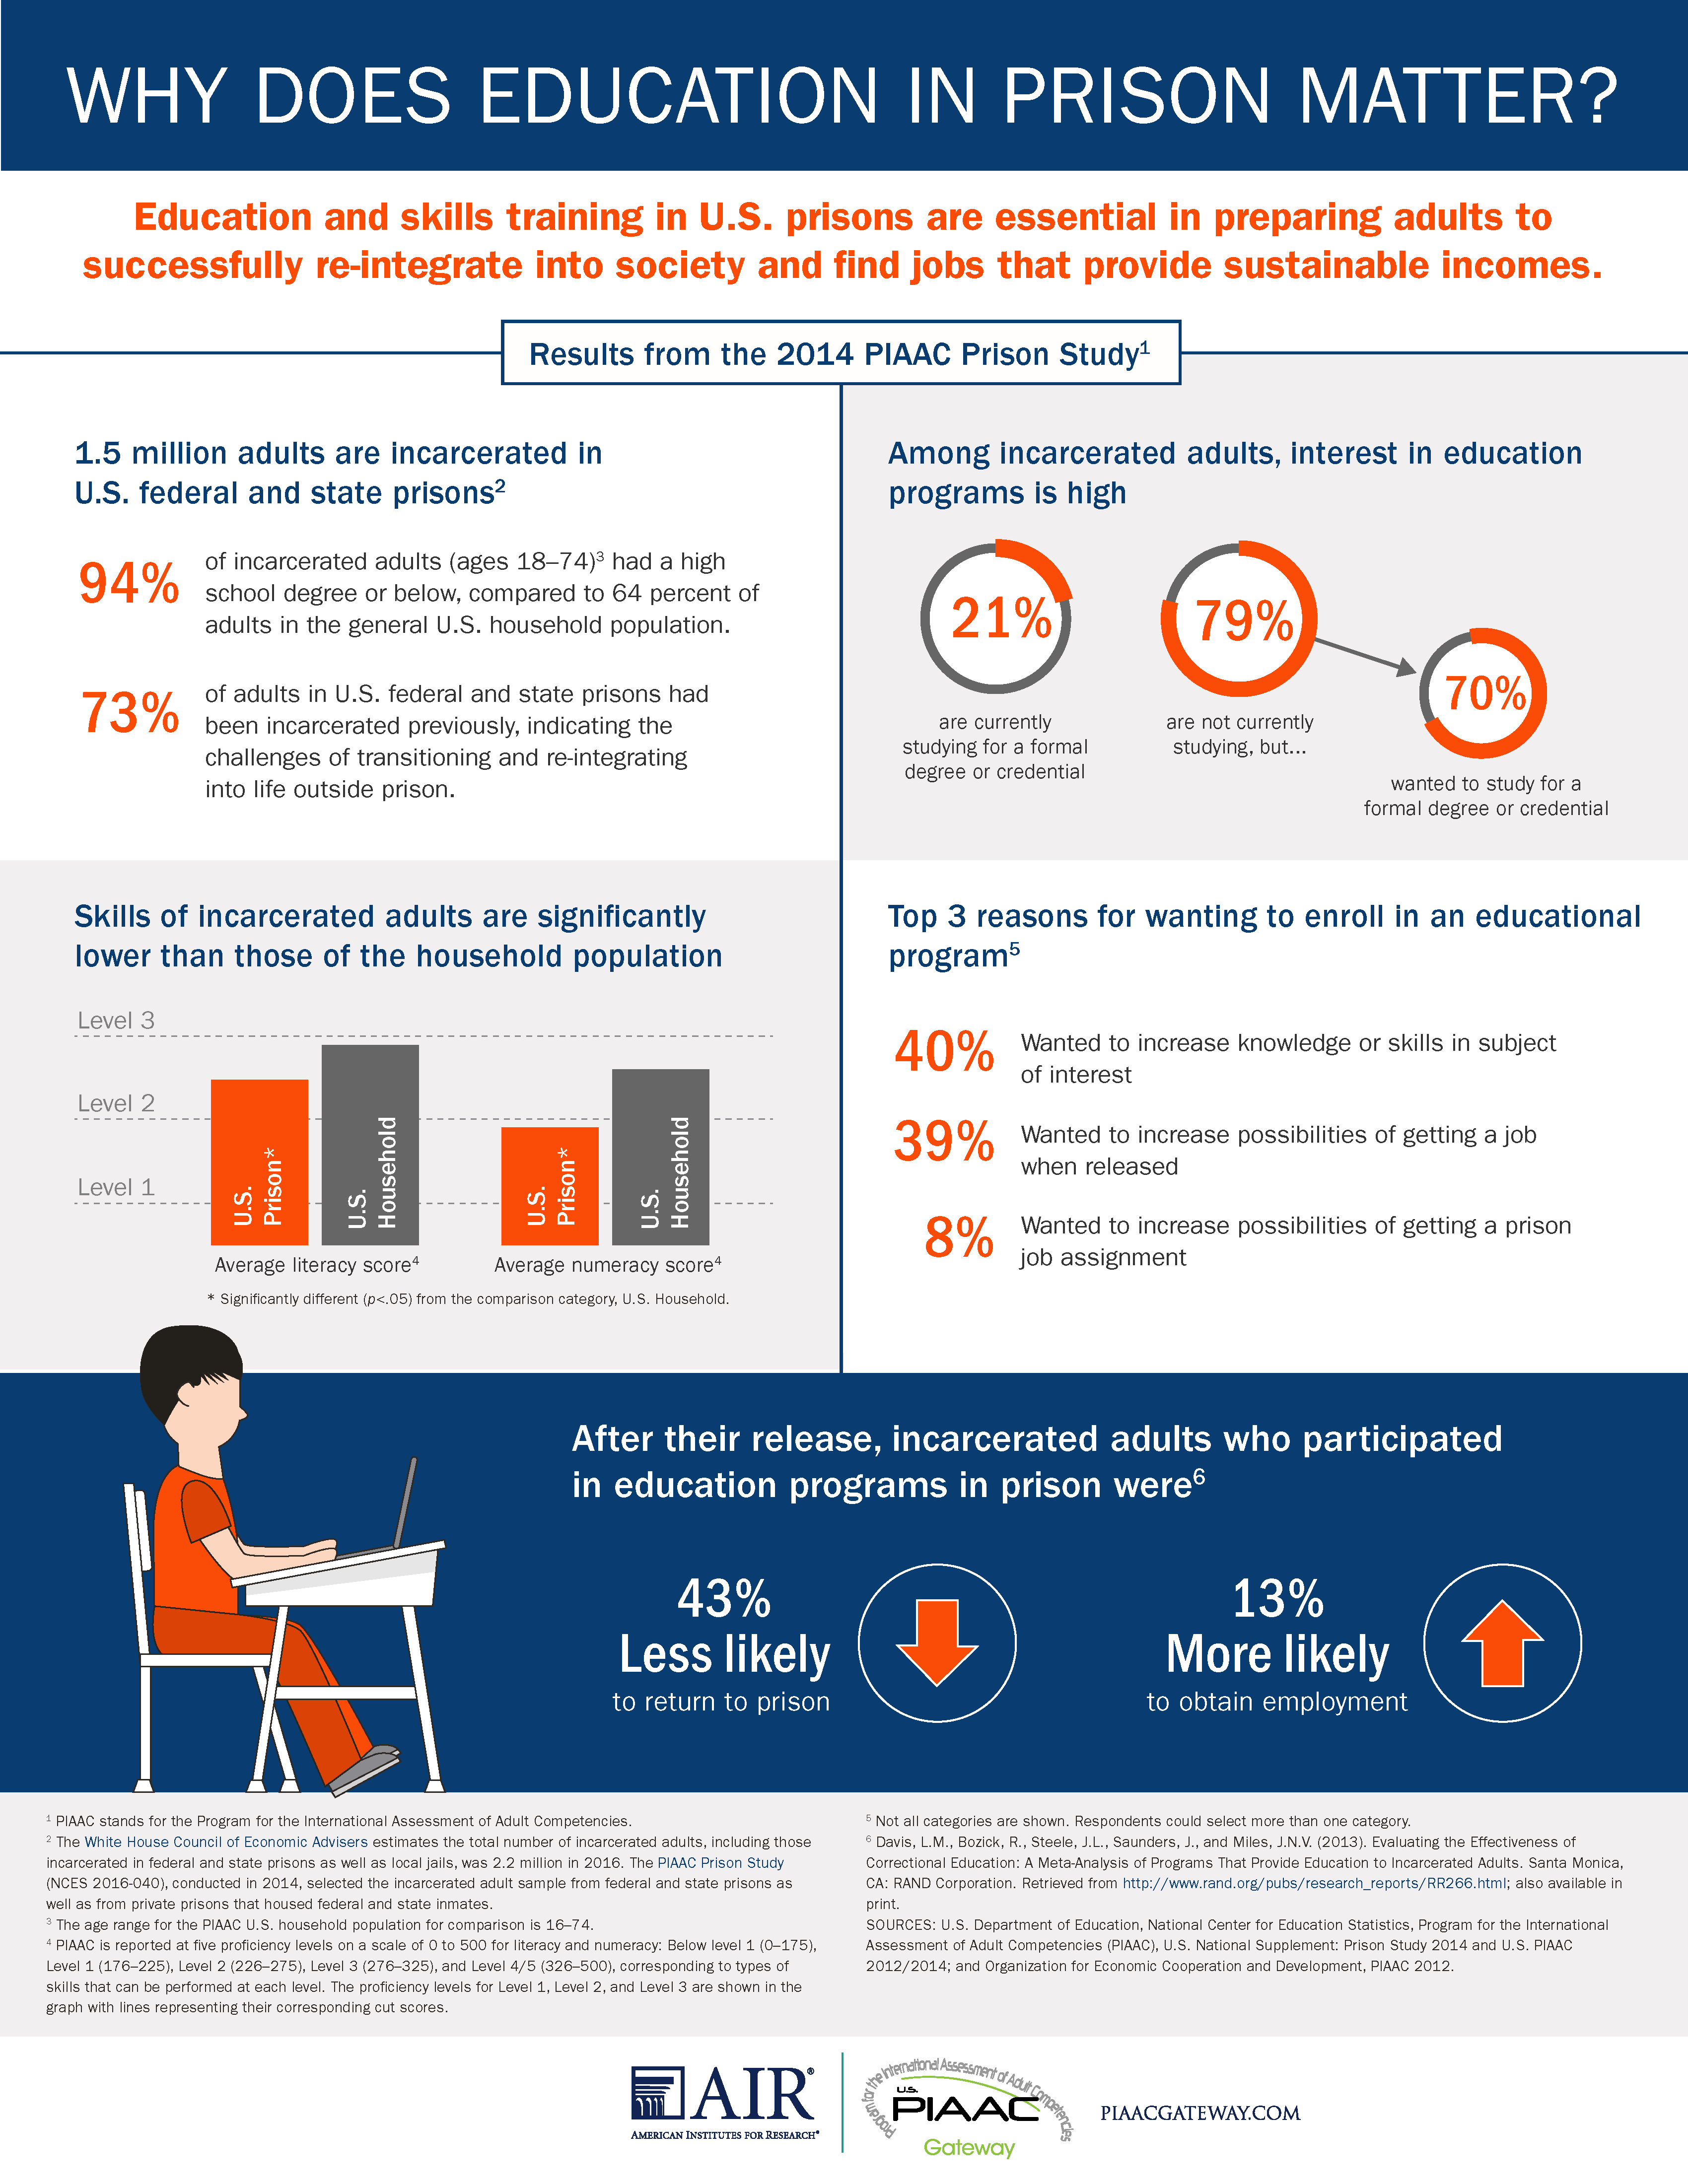
Why Does Education in Prison Matter?
This infographic uses 2014 Prison Study data and 2012/2014 household data to compare the skills of incarcerated adults with the household population.
Created with U.S. PIAAC 2014 Prison Study data and U.S. PIAAC 2012/2014 data.
View as PDF ›
View as image file ›
Print one copy on 8.5x11 paper ›
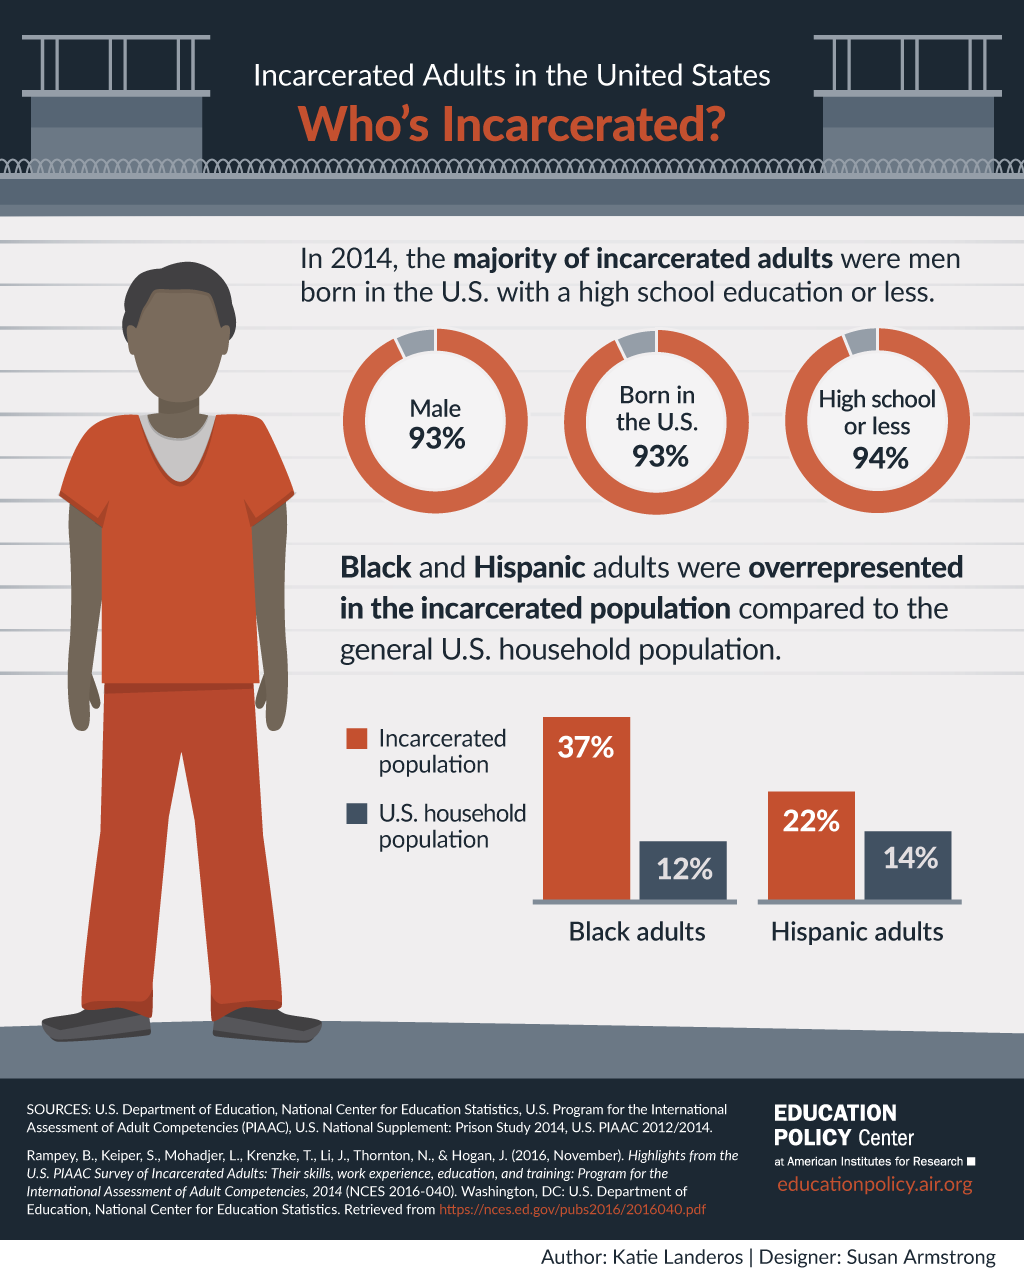
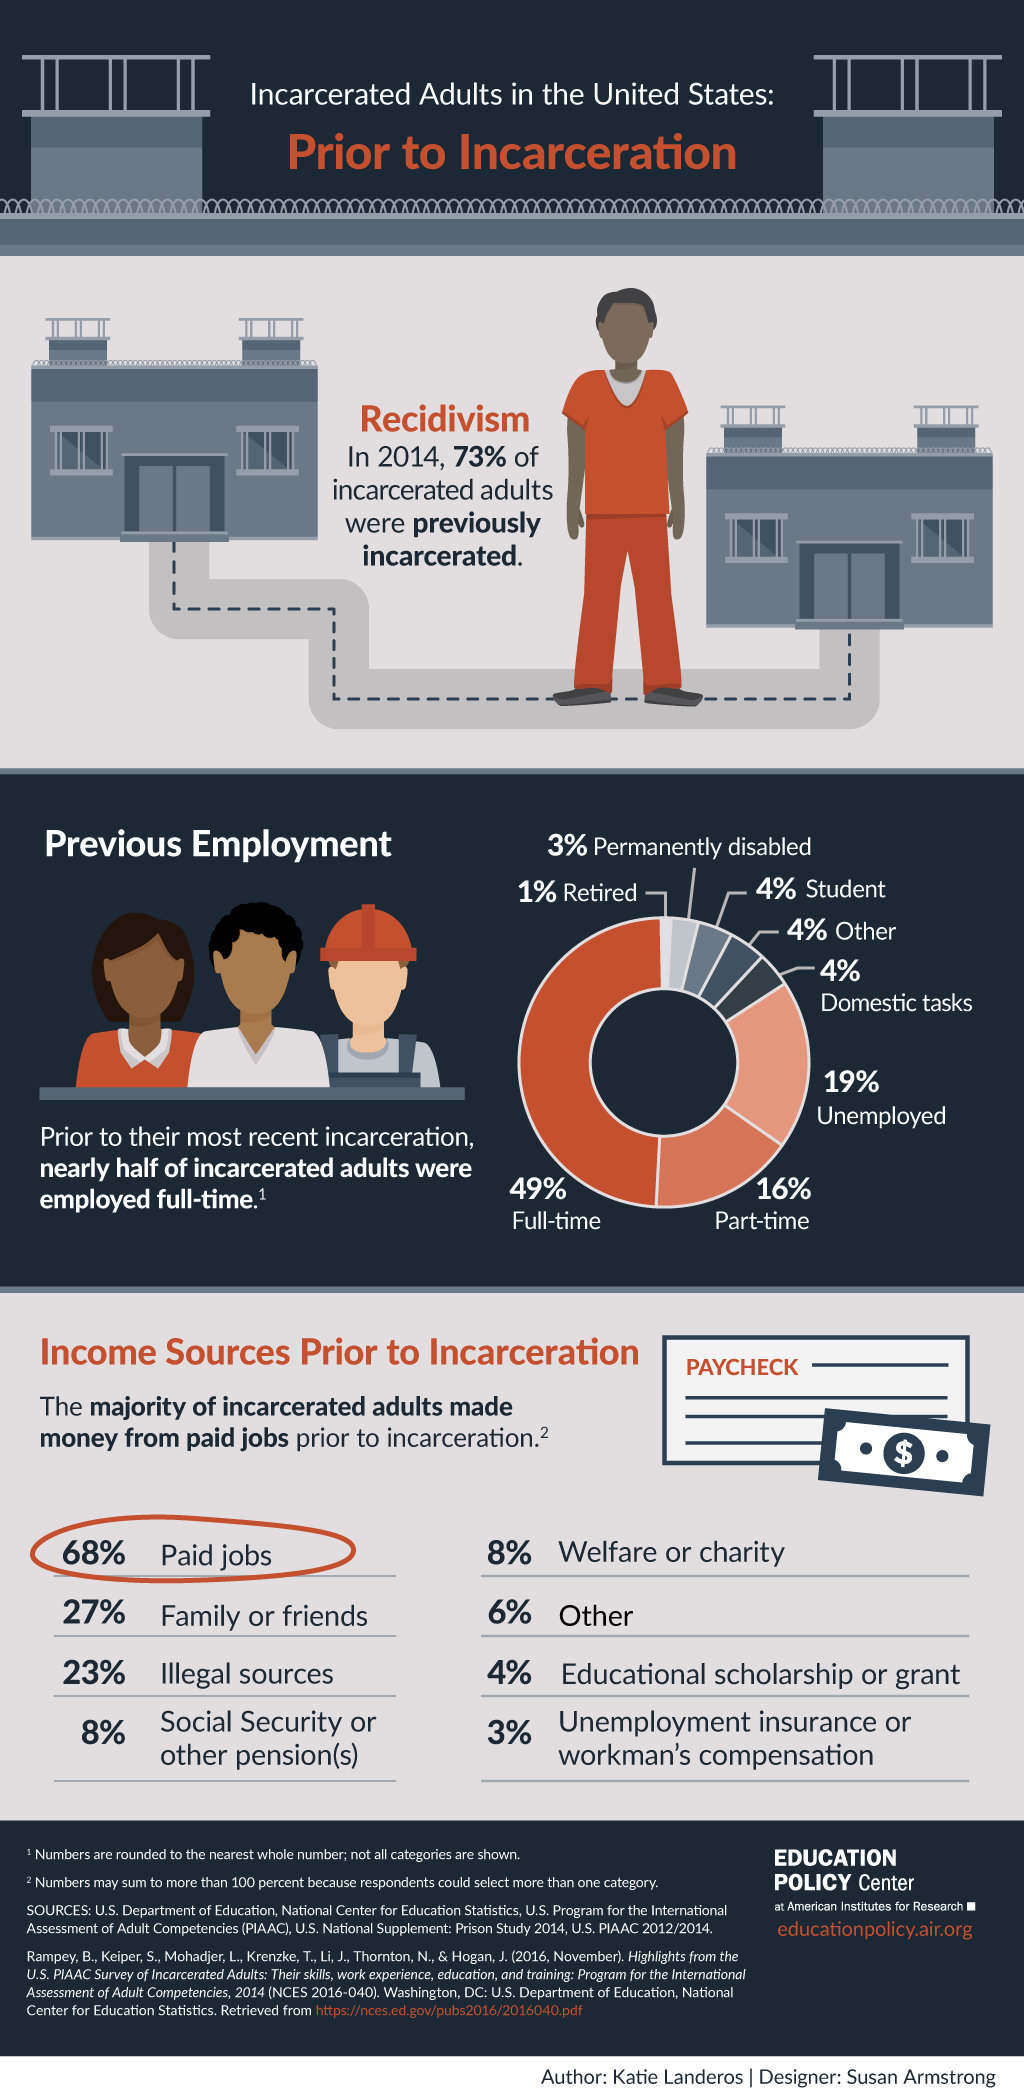
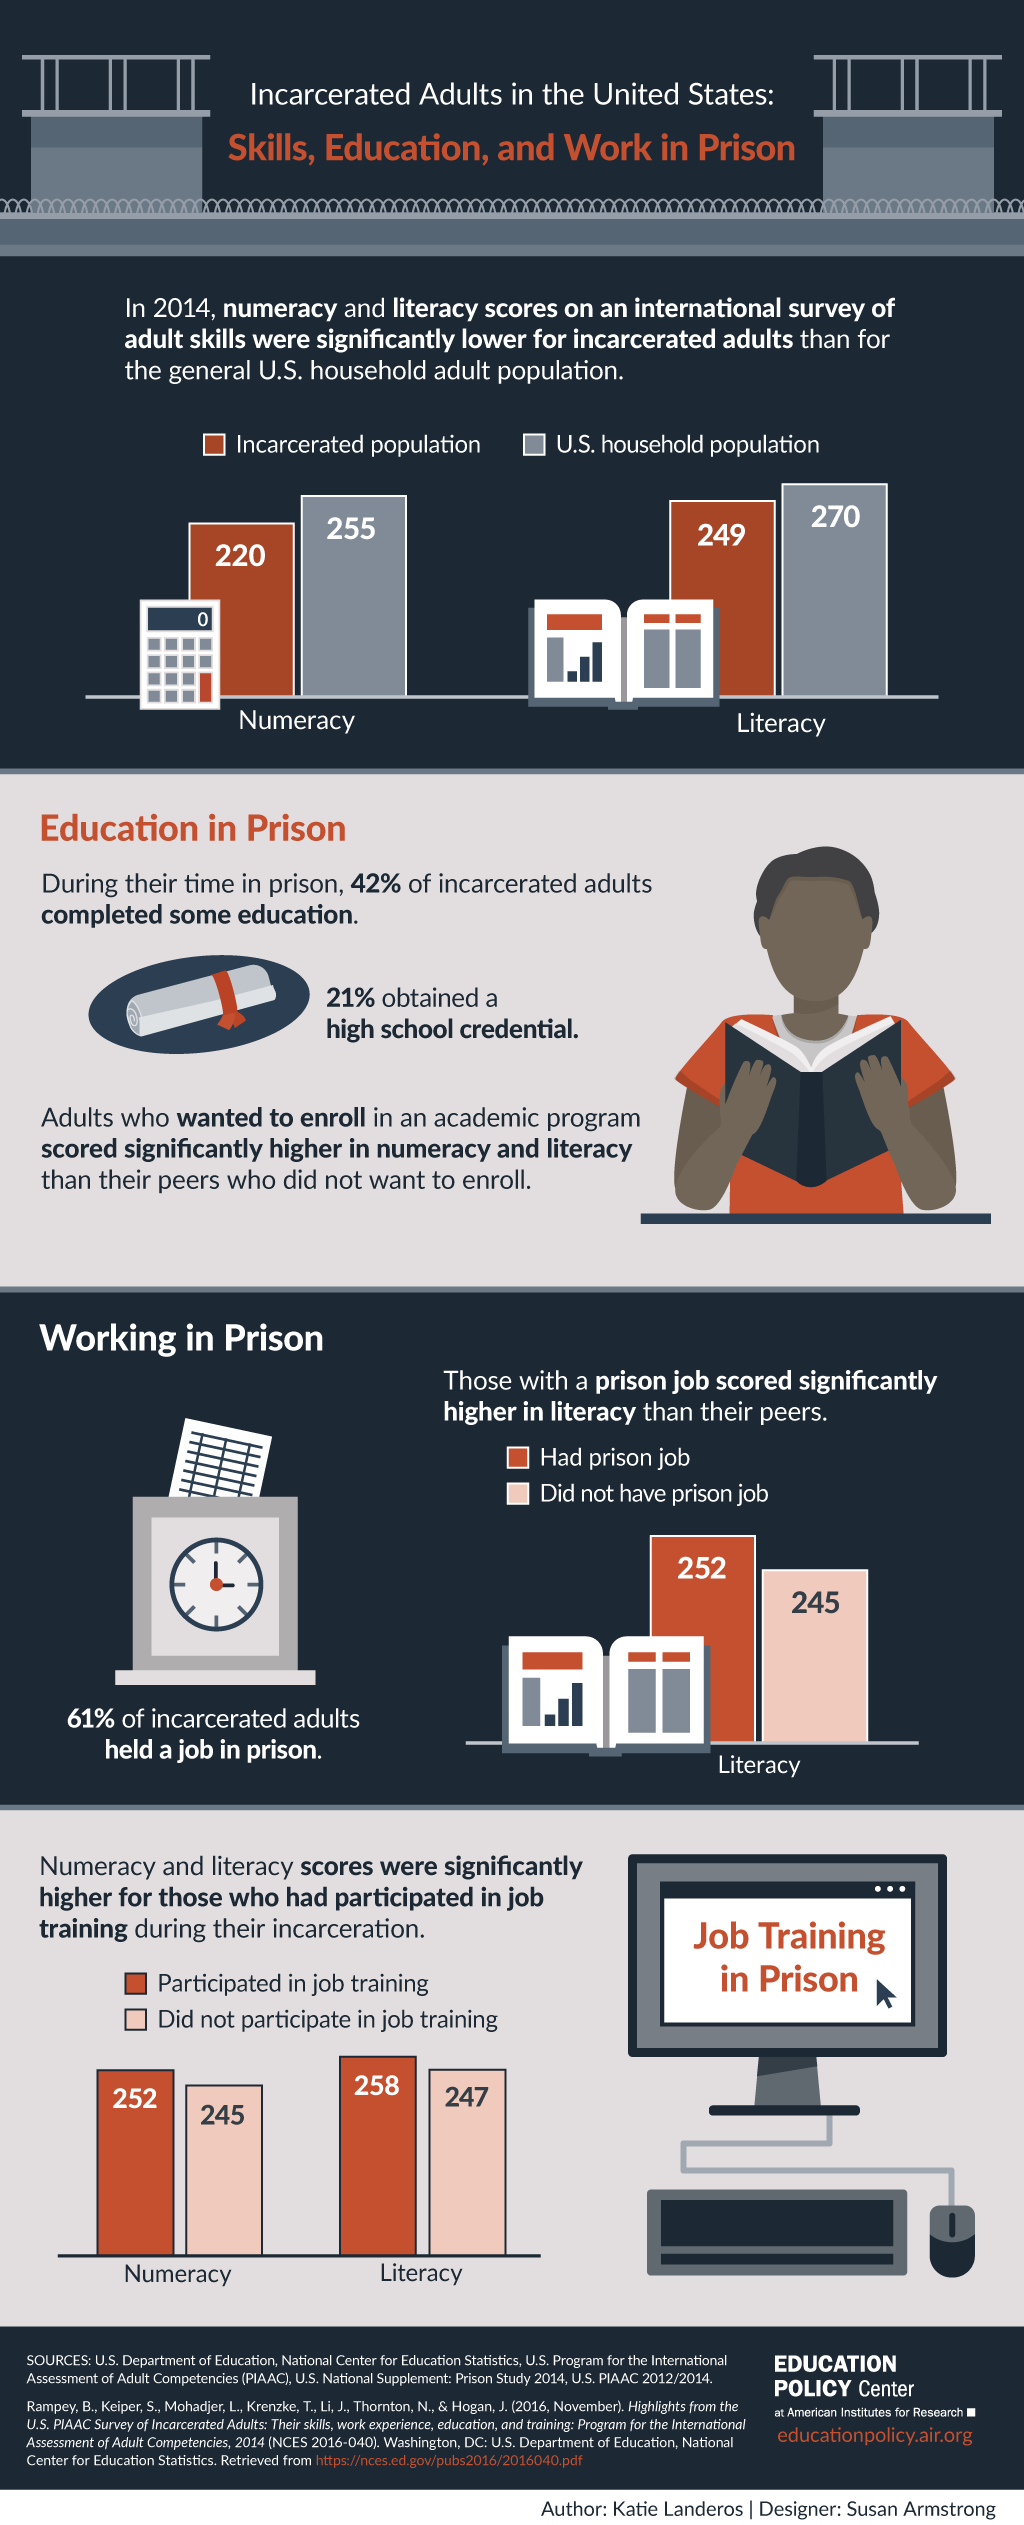
Incarcerated Adults in the United States
This series of infographics uses data from the U.S. PIAAC 2014 Prison Study to present findings related to the cognitive skills and backgrounds of the U.S. prison population.
Created with U.S. PIAAC 2014 Prison Study data.
View "Who's Incarcerated?" as PDF ›
View "Prior to Incarceration" as PDF ›
View "Skills, Education, and Work in Prison" as PDF ›
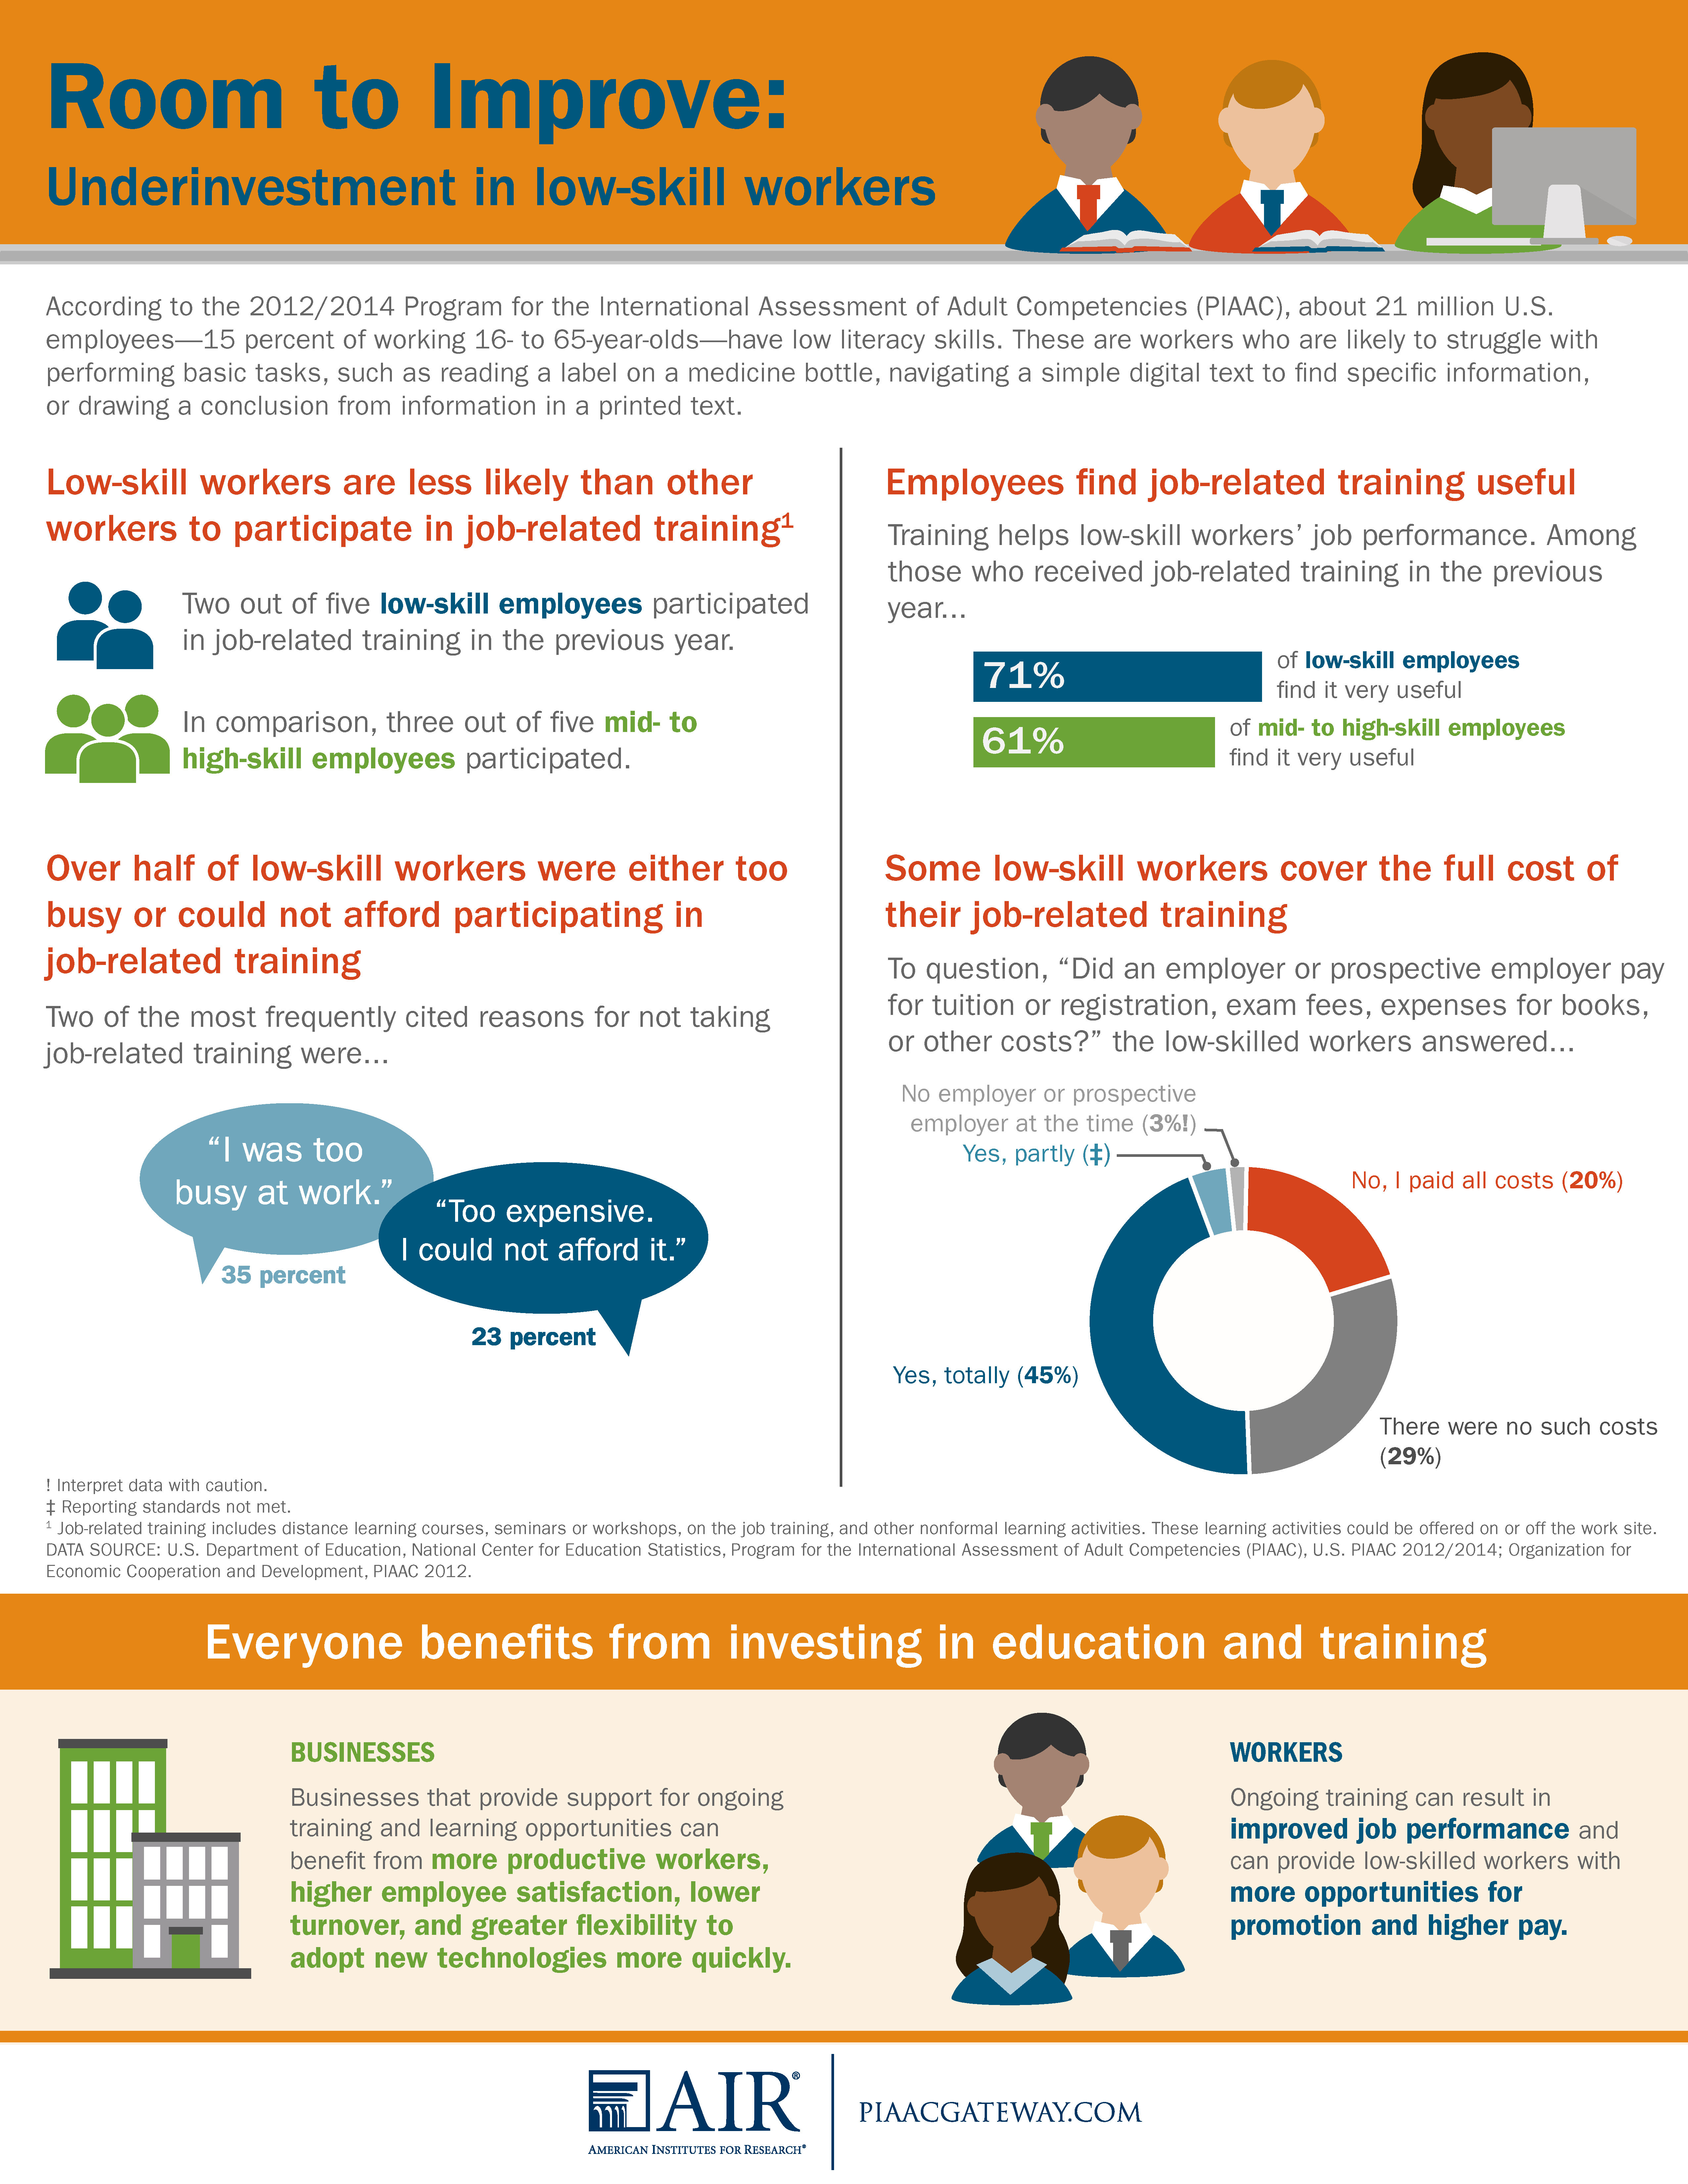
Room to Improve
This infographic focuses on low-skilled workers in the United States and their participation in job-related training.
Created with U.S. PIAAC 2012/2014 data.
View as PDF ›
View as image file ›
Print one copy on 8.5x11 paper ›
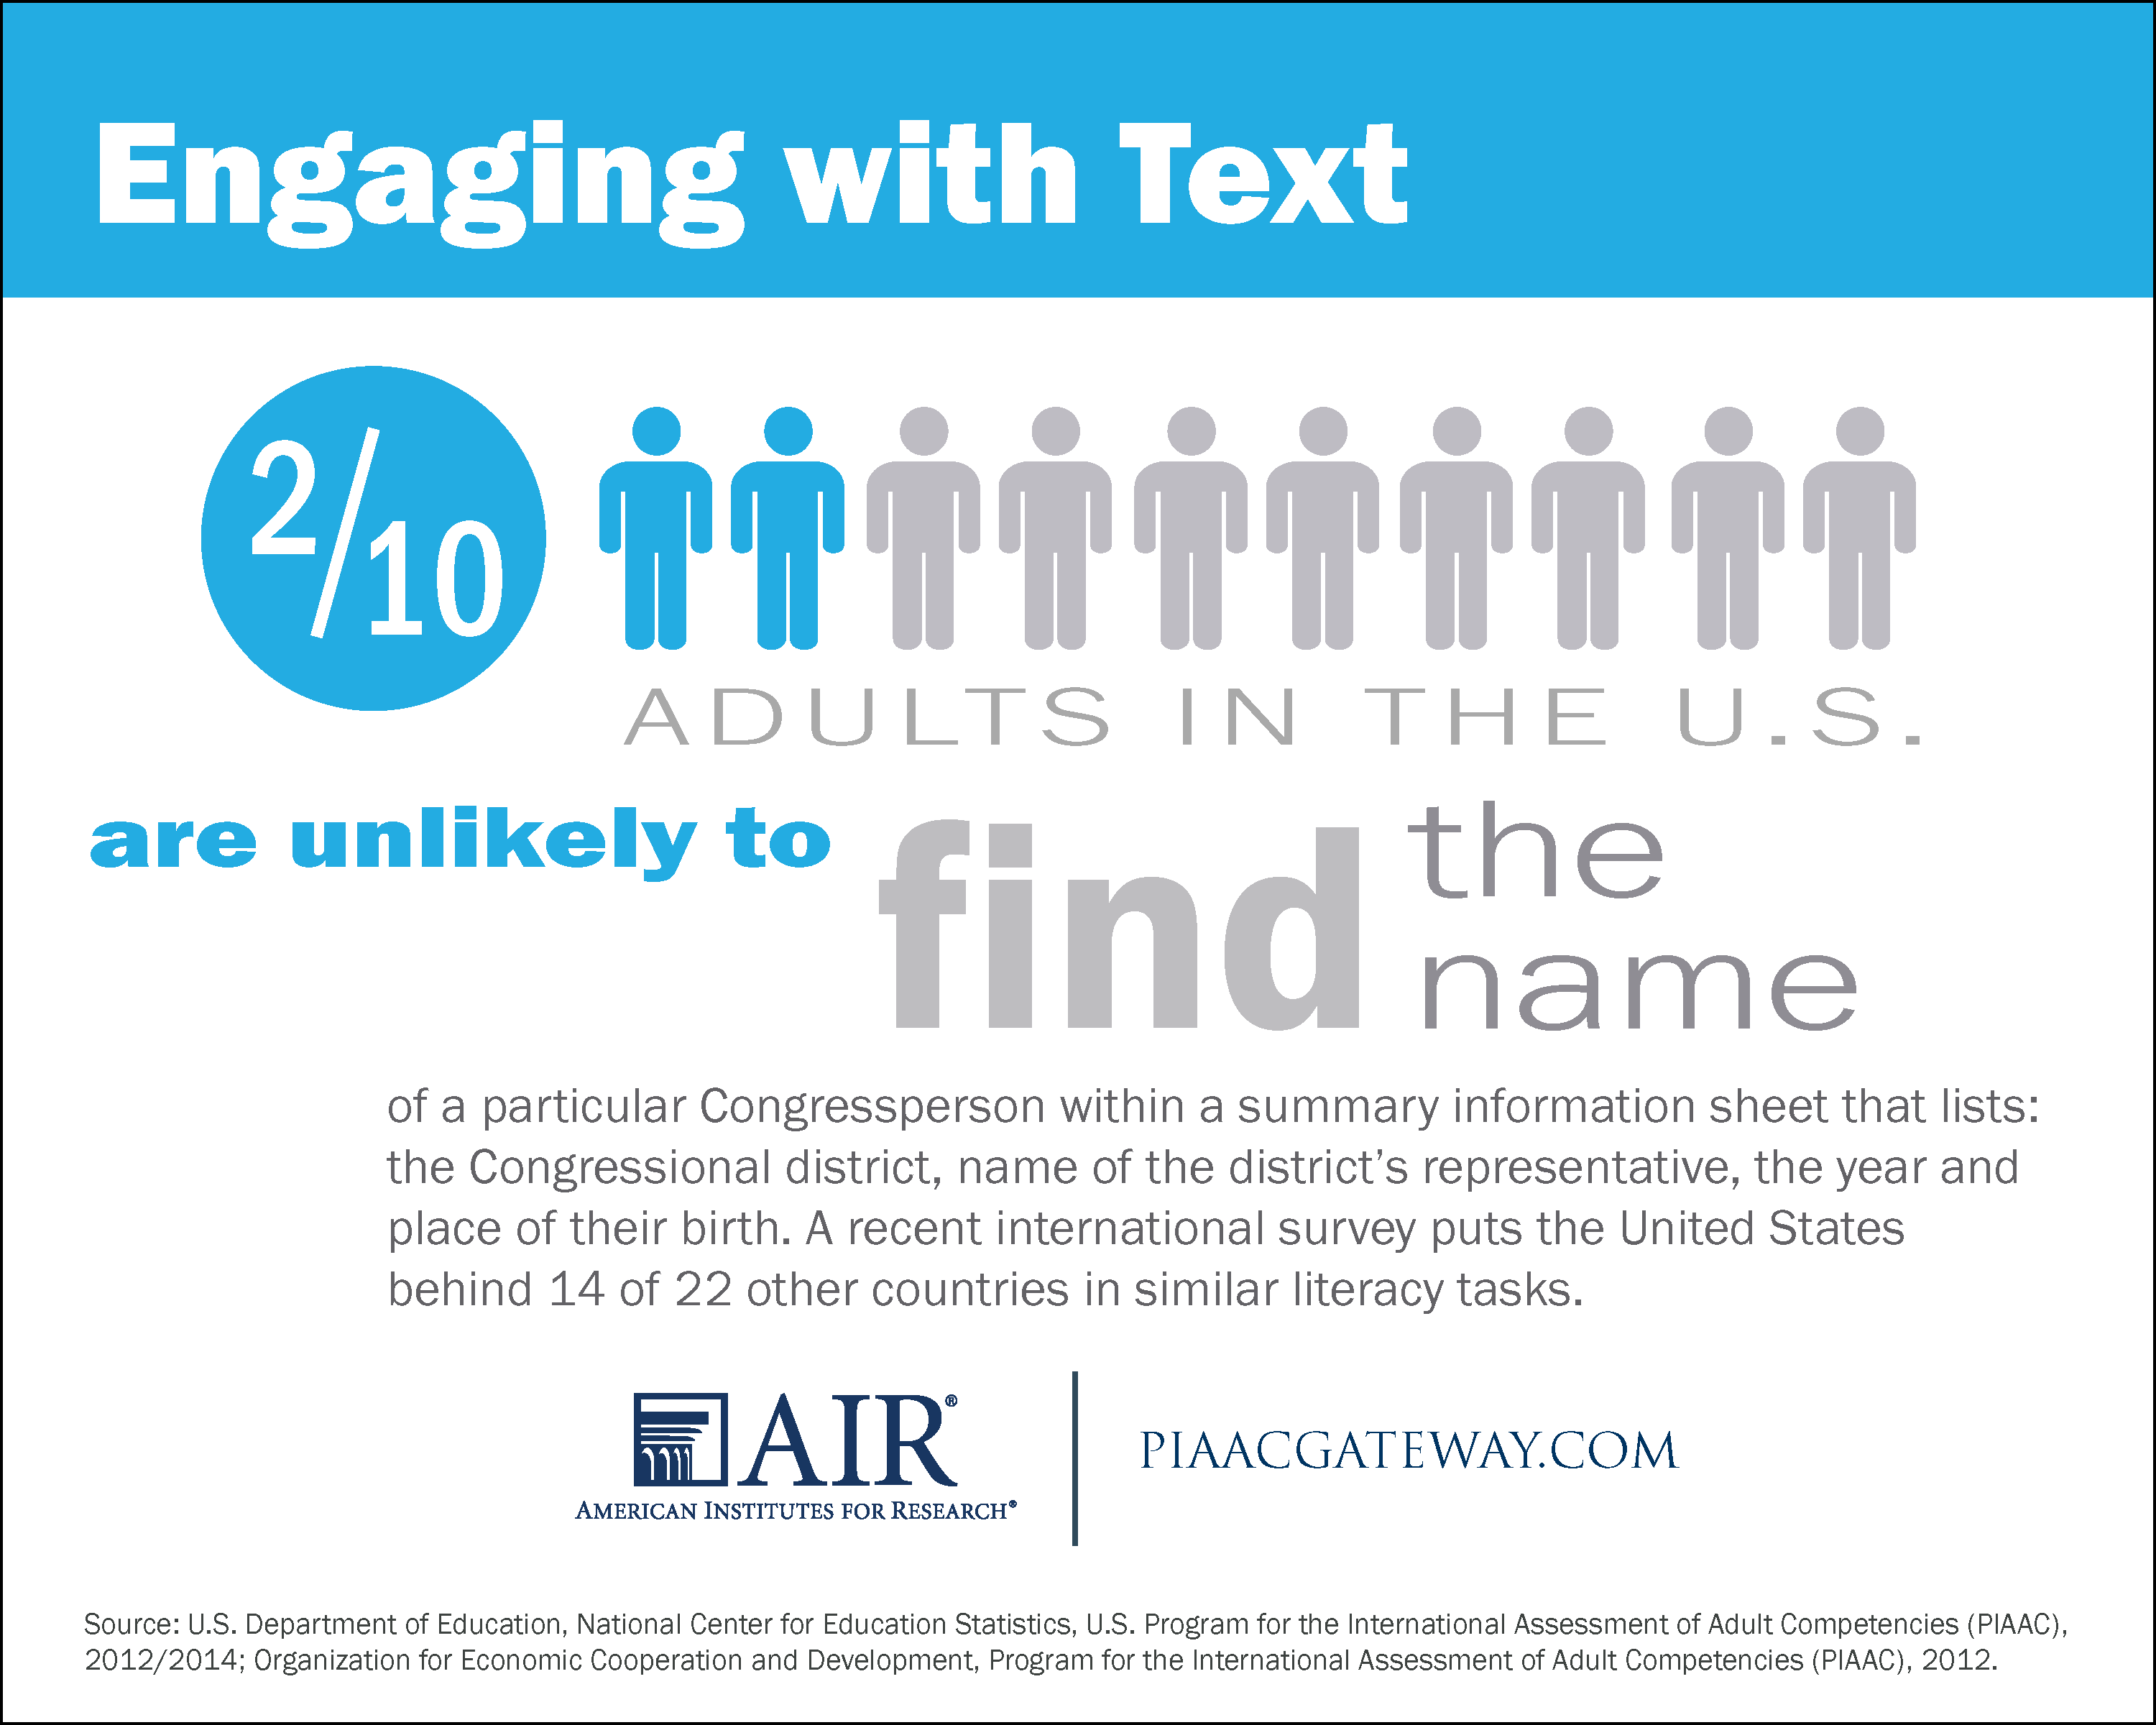
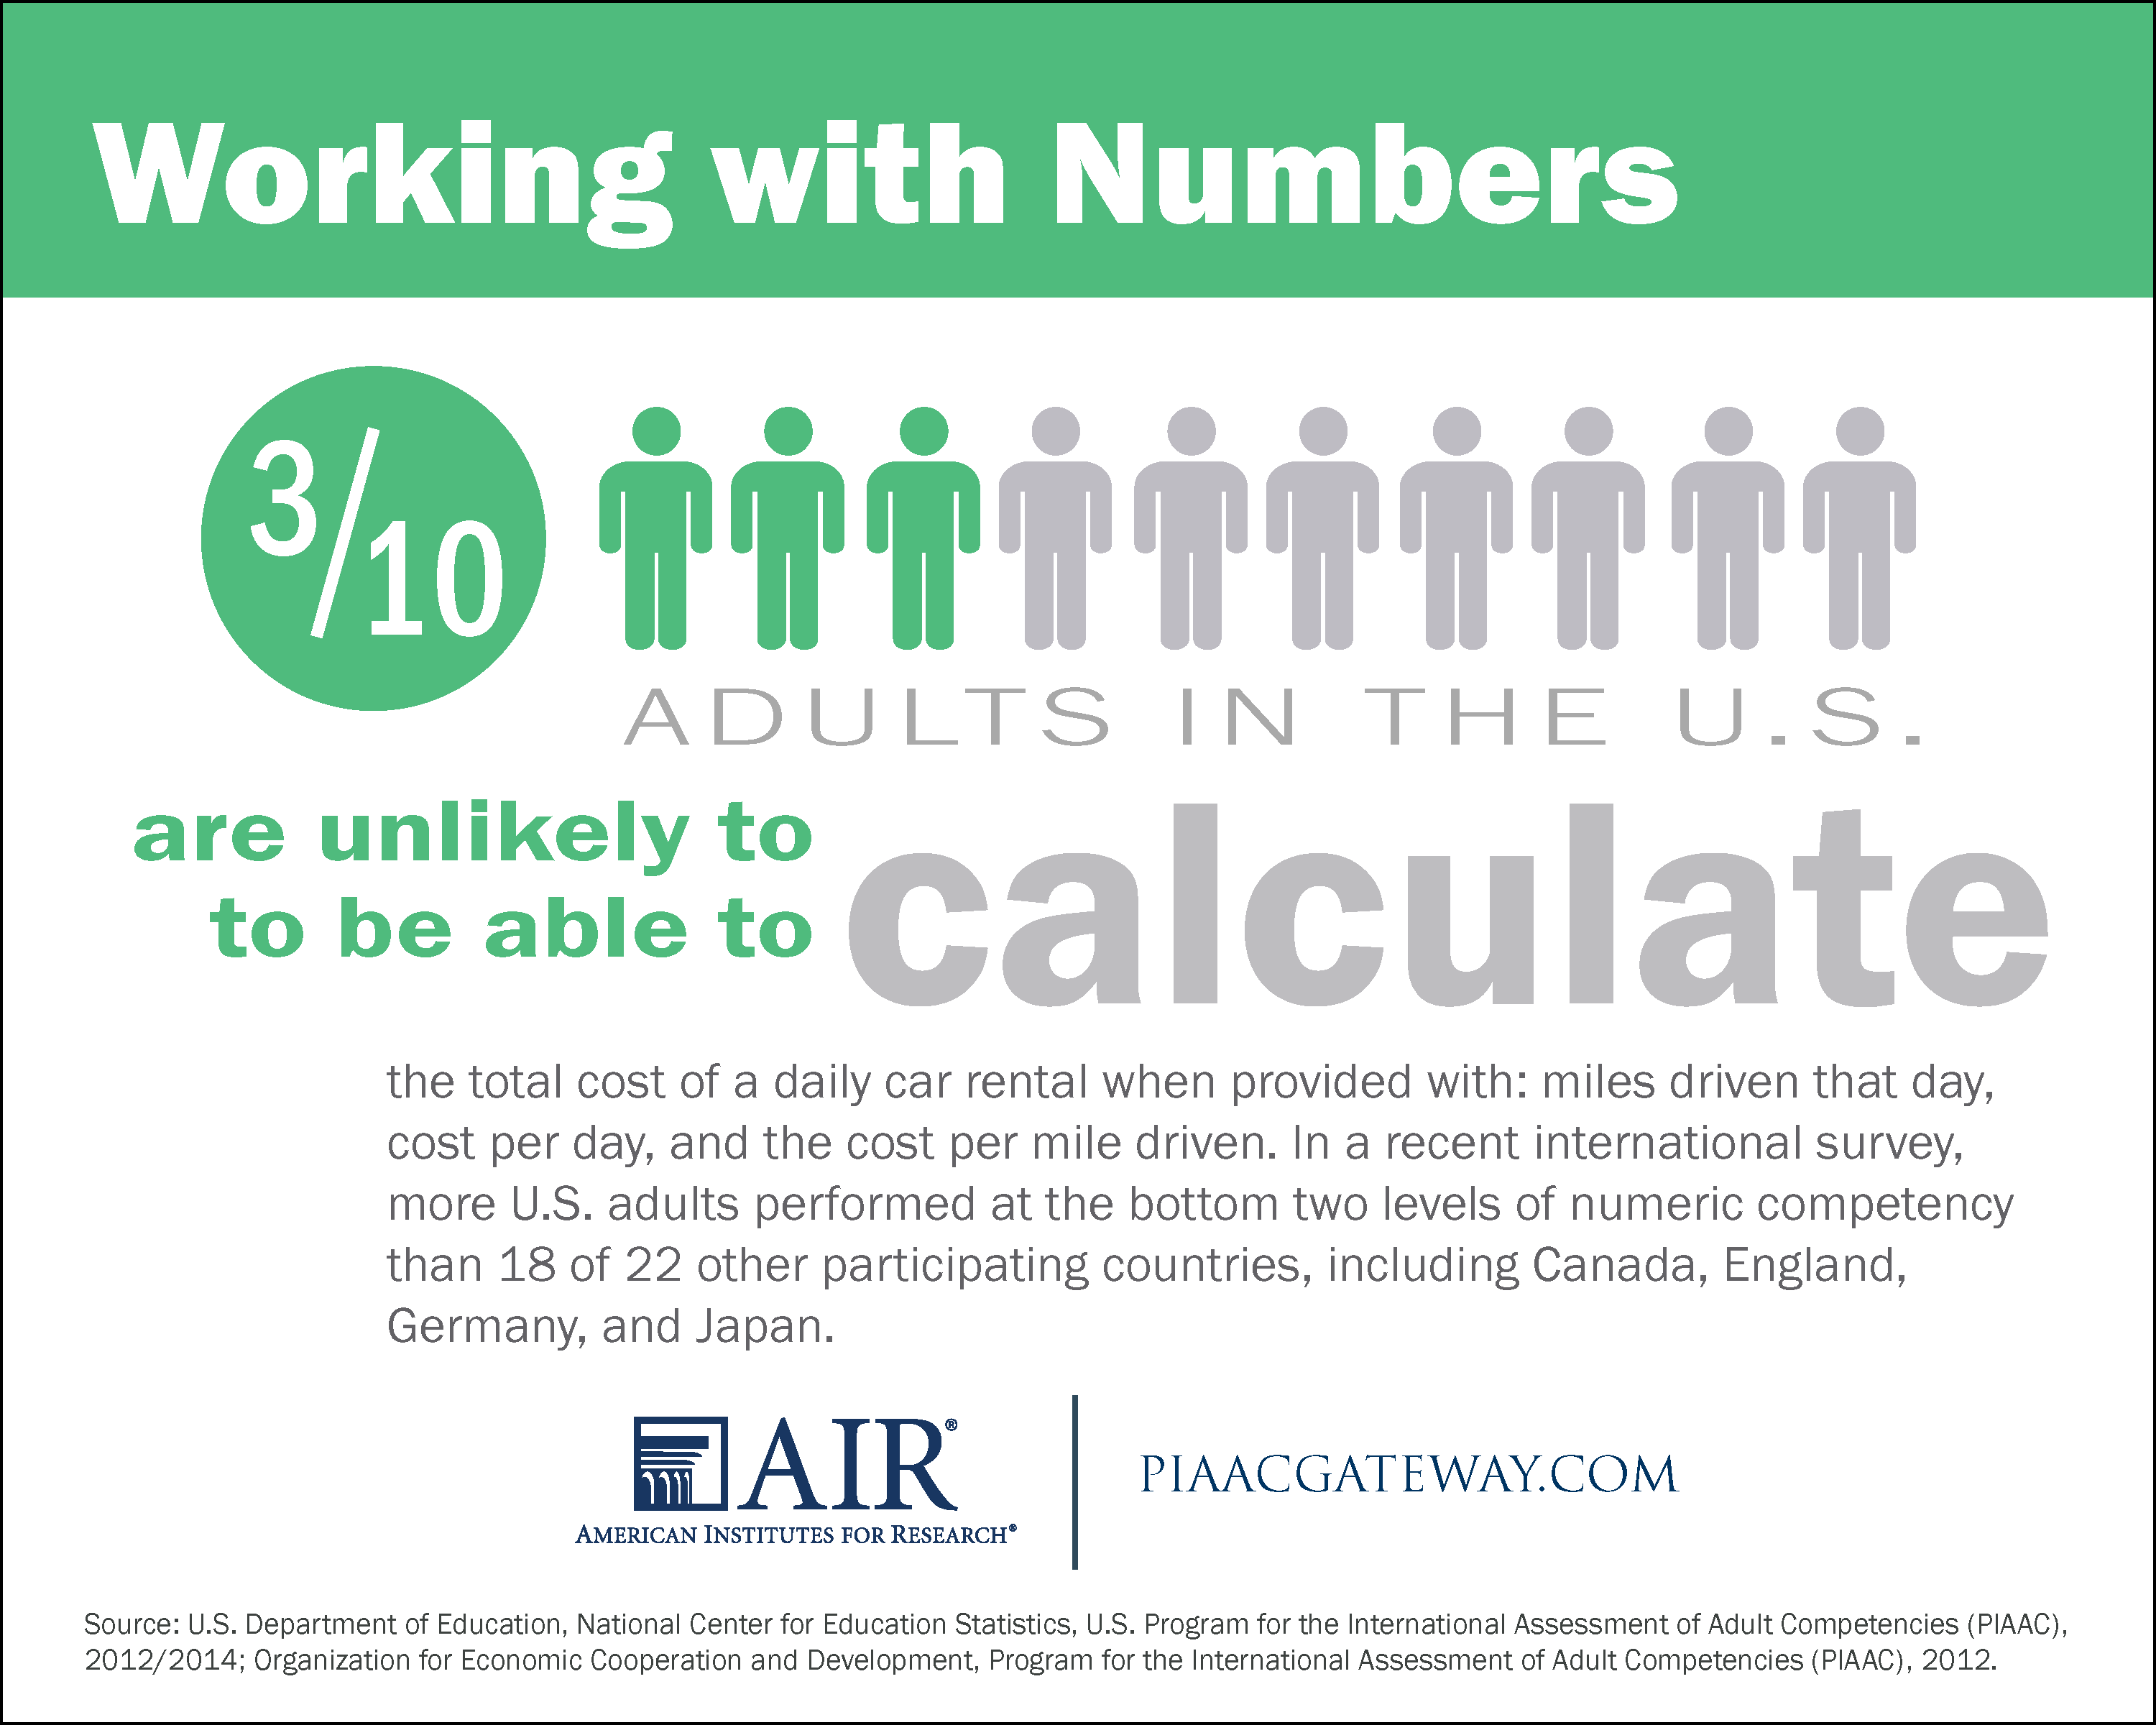
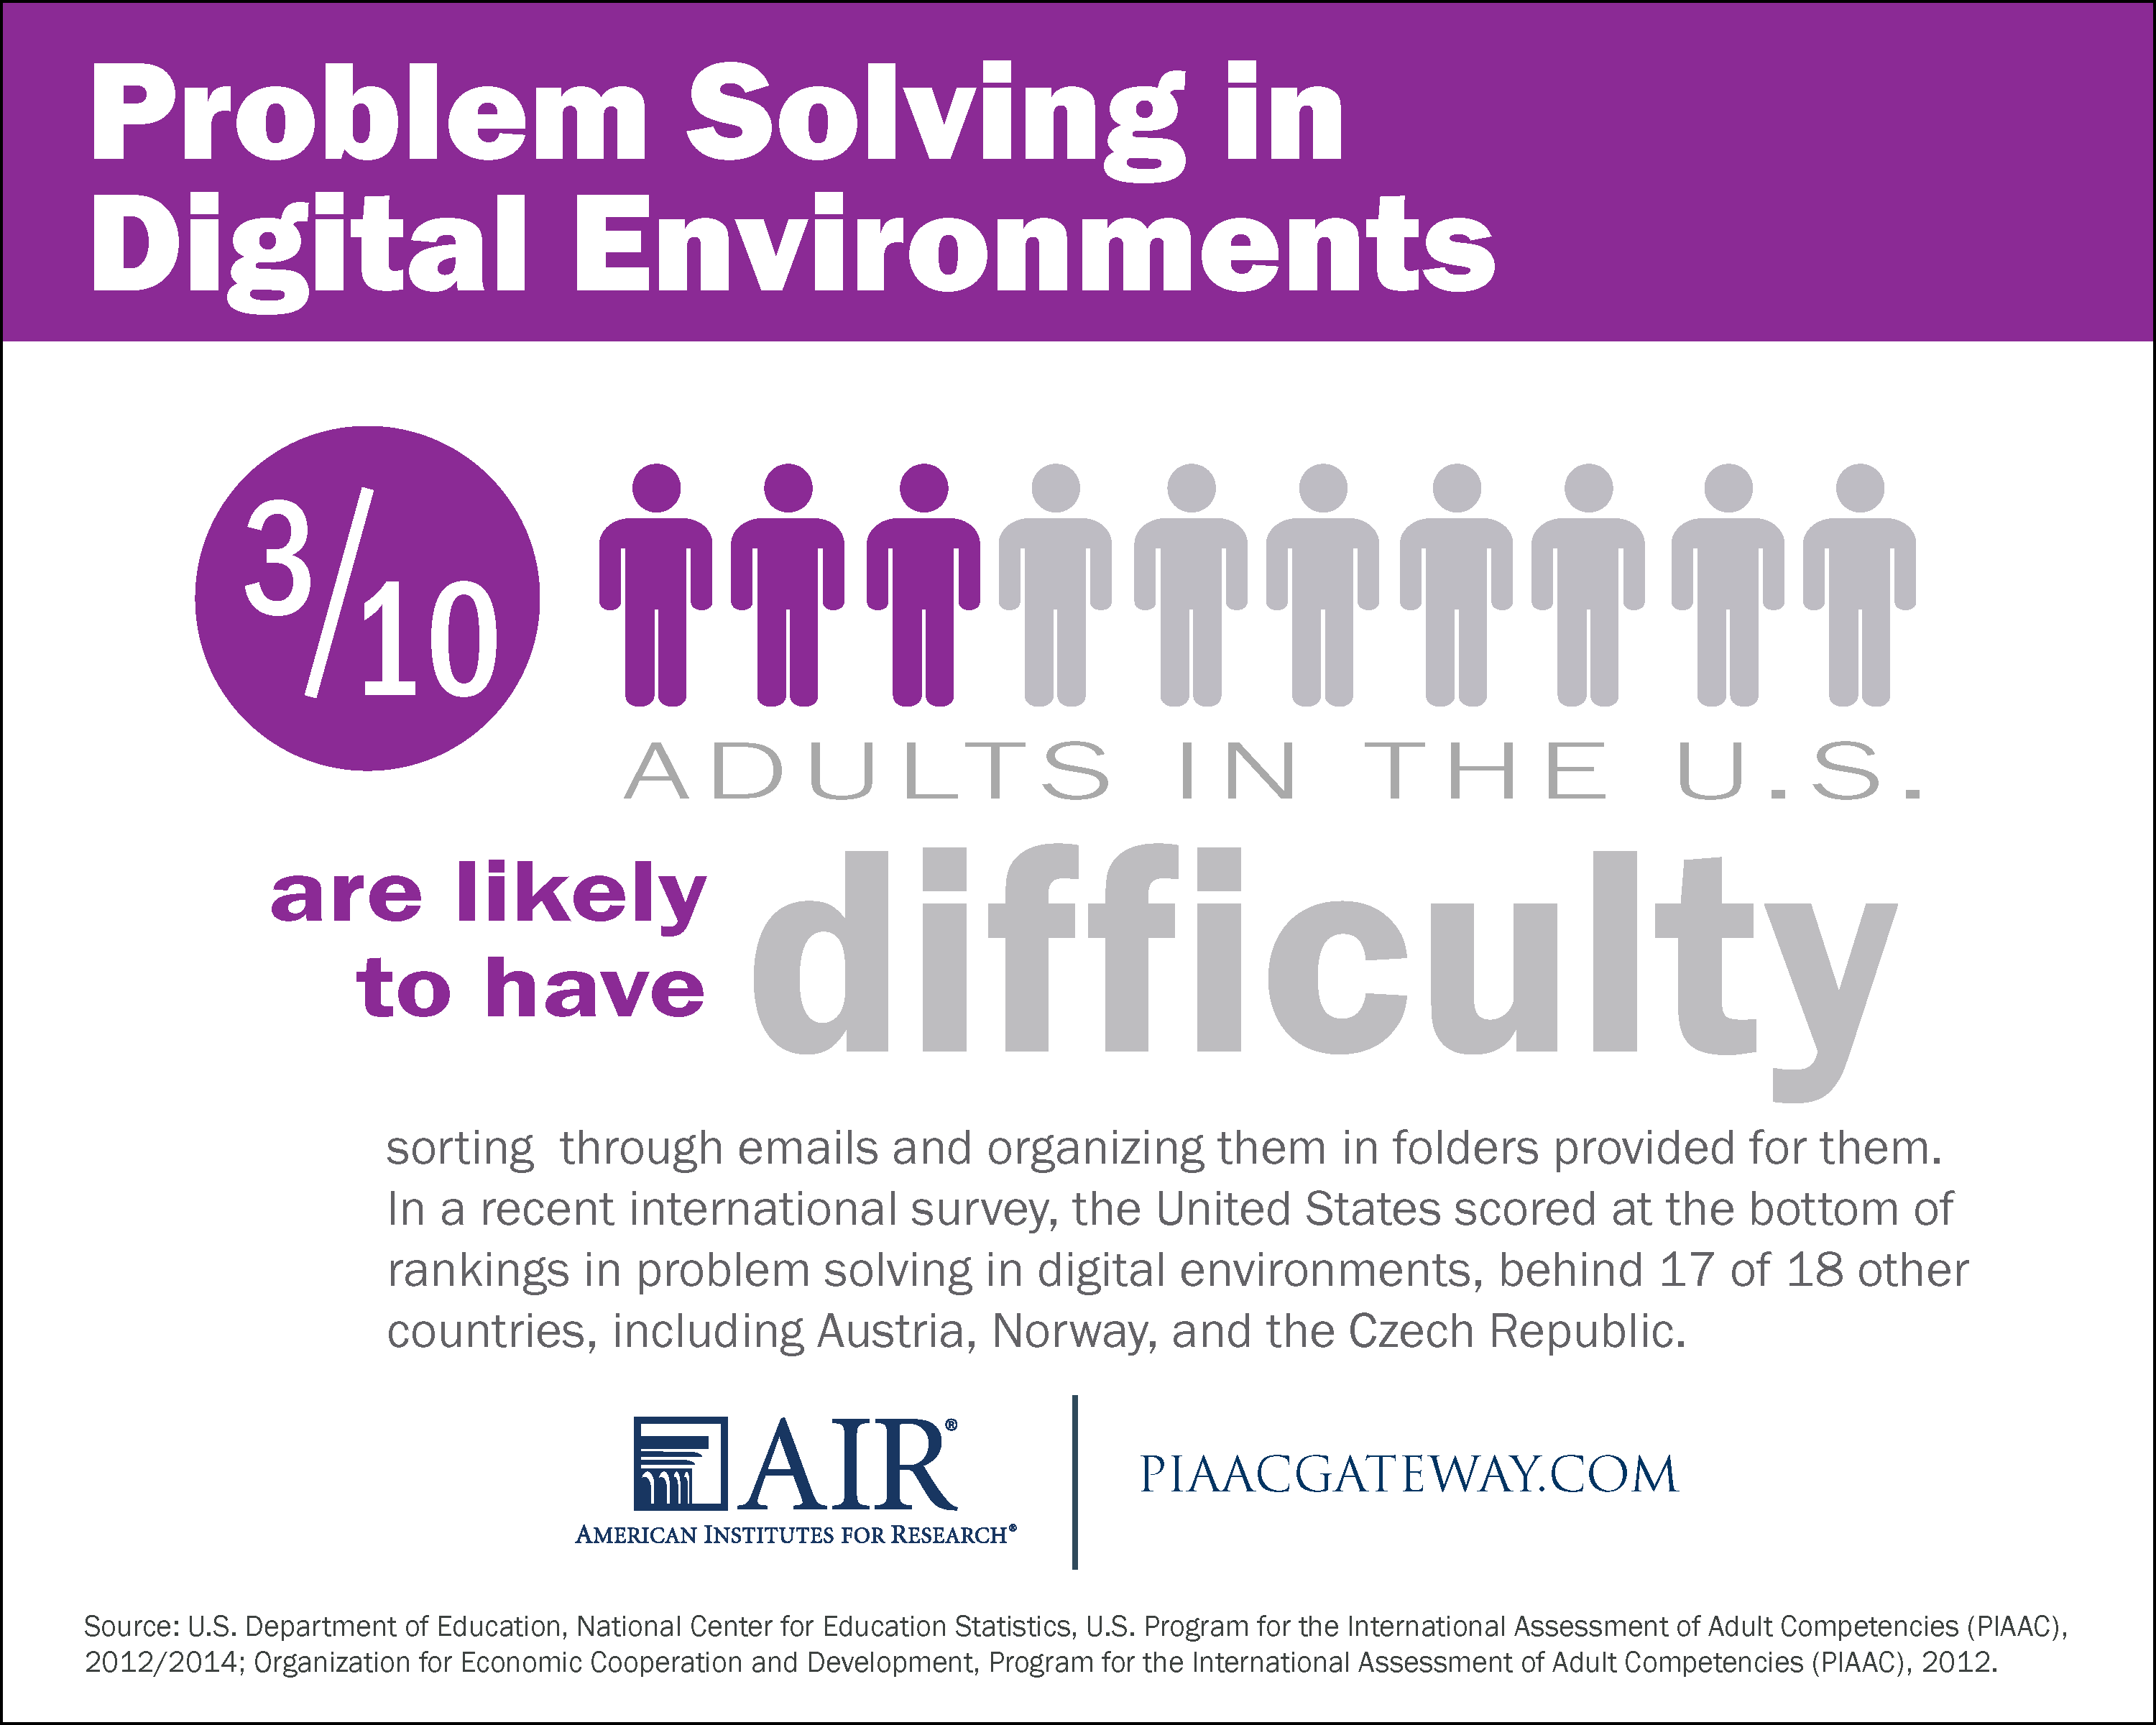
"Facts from PIAAC" Postcards
These three postcard-size infographics feature facts about the performance of U.S. adults in literacy, numeracy, and problem solving in digital environments in comparison to their international peers.
*Updated on 3/10/16 with U.S. PIAAC 2012/2014 data.
View as PDF ›
View as image files: Literacy › Numeracy › Problem Solving ›
Download images (ZIP file) ›
Print four copies of each infographic on 8.5x11 paper ›
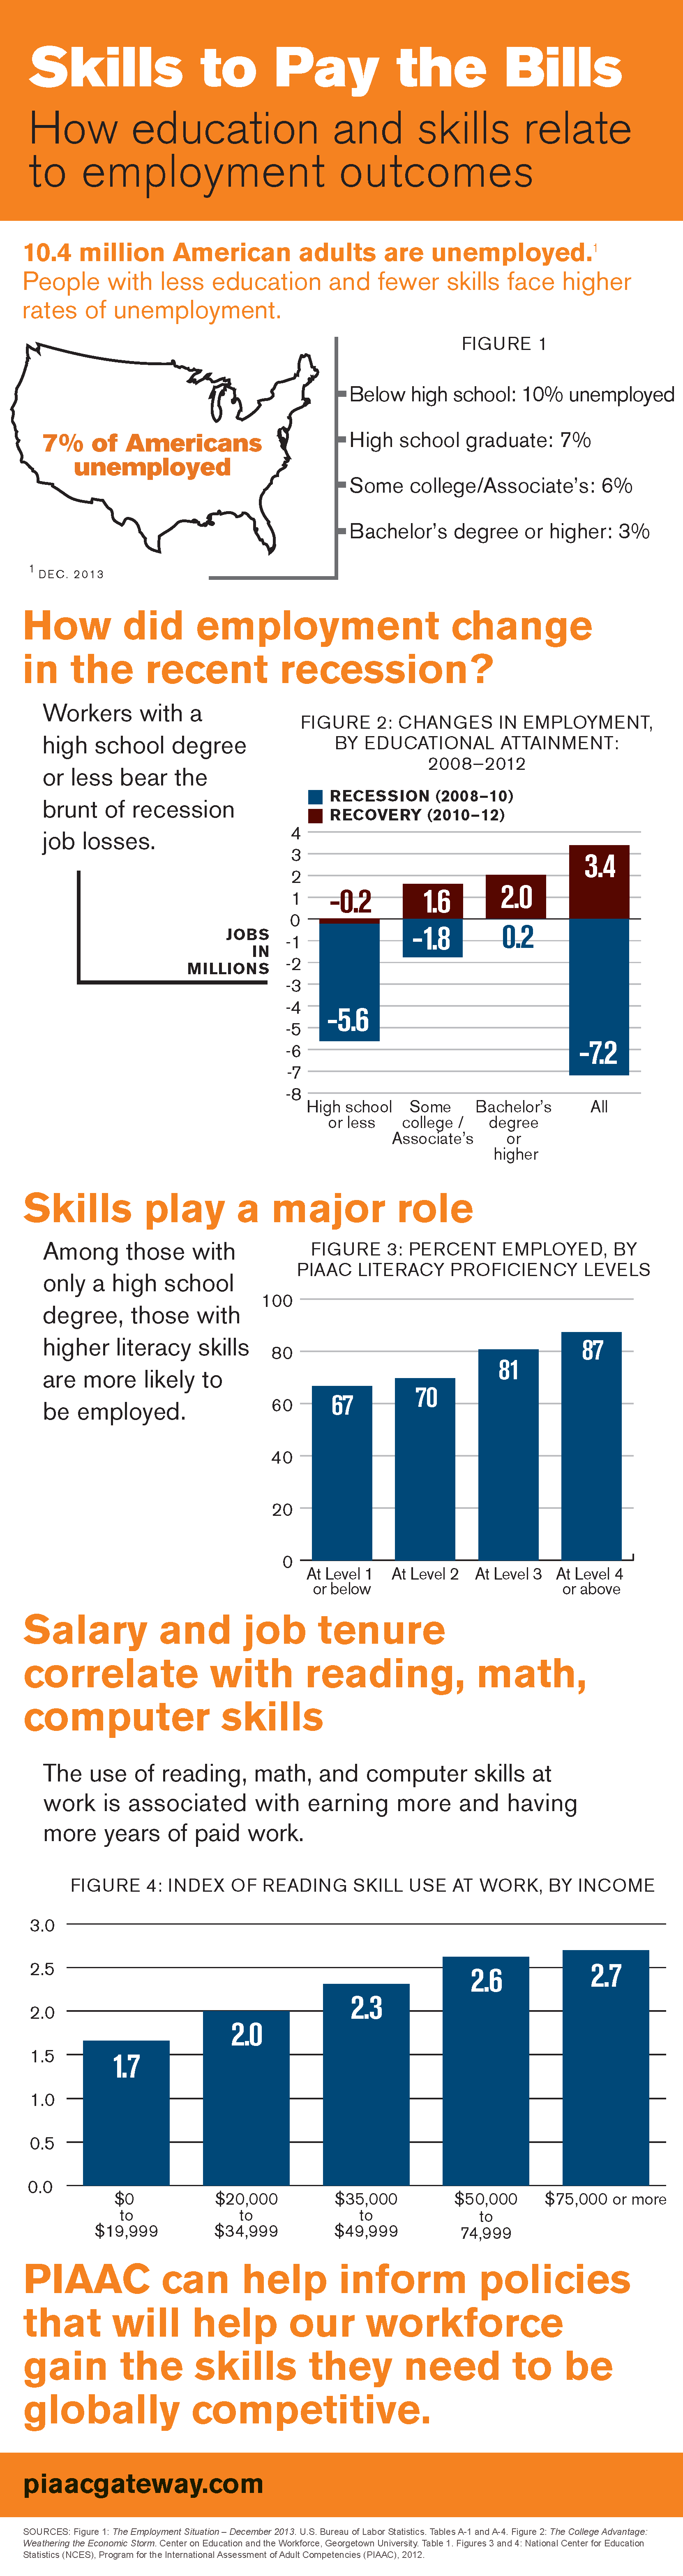
Skills to Pay the Bills
This infographic focuses on how skills and education relate to employment by looking at the relationship between performance on the PIAAC assessment and a variety of employment indicators.
*Updated on 4/7/16 with U.S. PIAAC 2012/2014 data.
View as PDF ›
View as an image file ›
Print five copies on 11x17 paper ›

Getting Back Up to Speed
This infographic focuses on the skills of U.S. young adults (ages 16-24) and uses PIAAC data to provide insight into how their skills compare to other countries in today's global economy.
*Updated on 10/25/16 with U.S. PIAAC 2012/2014 data.
View as PDF ›
View as image file ›
Print three copies on 11x17 paper ›
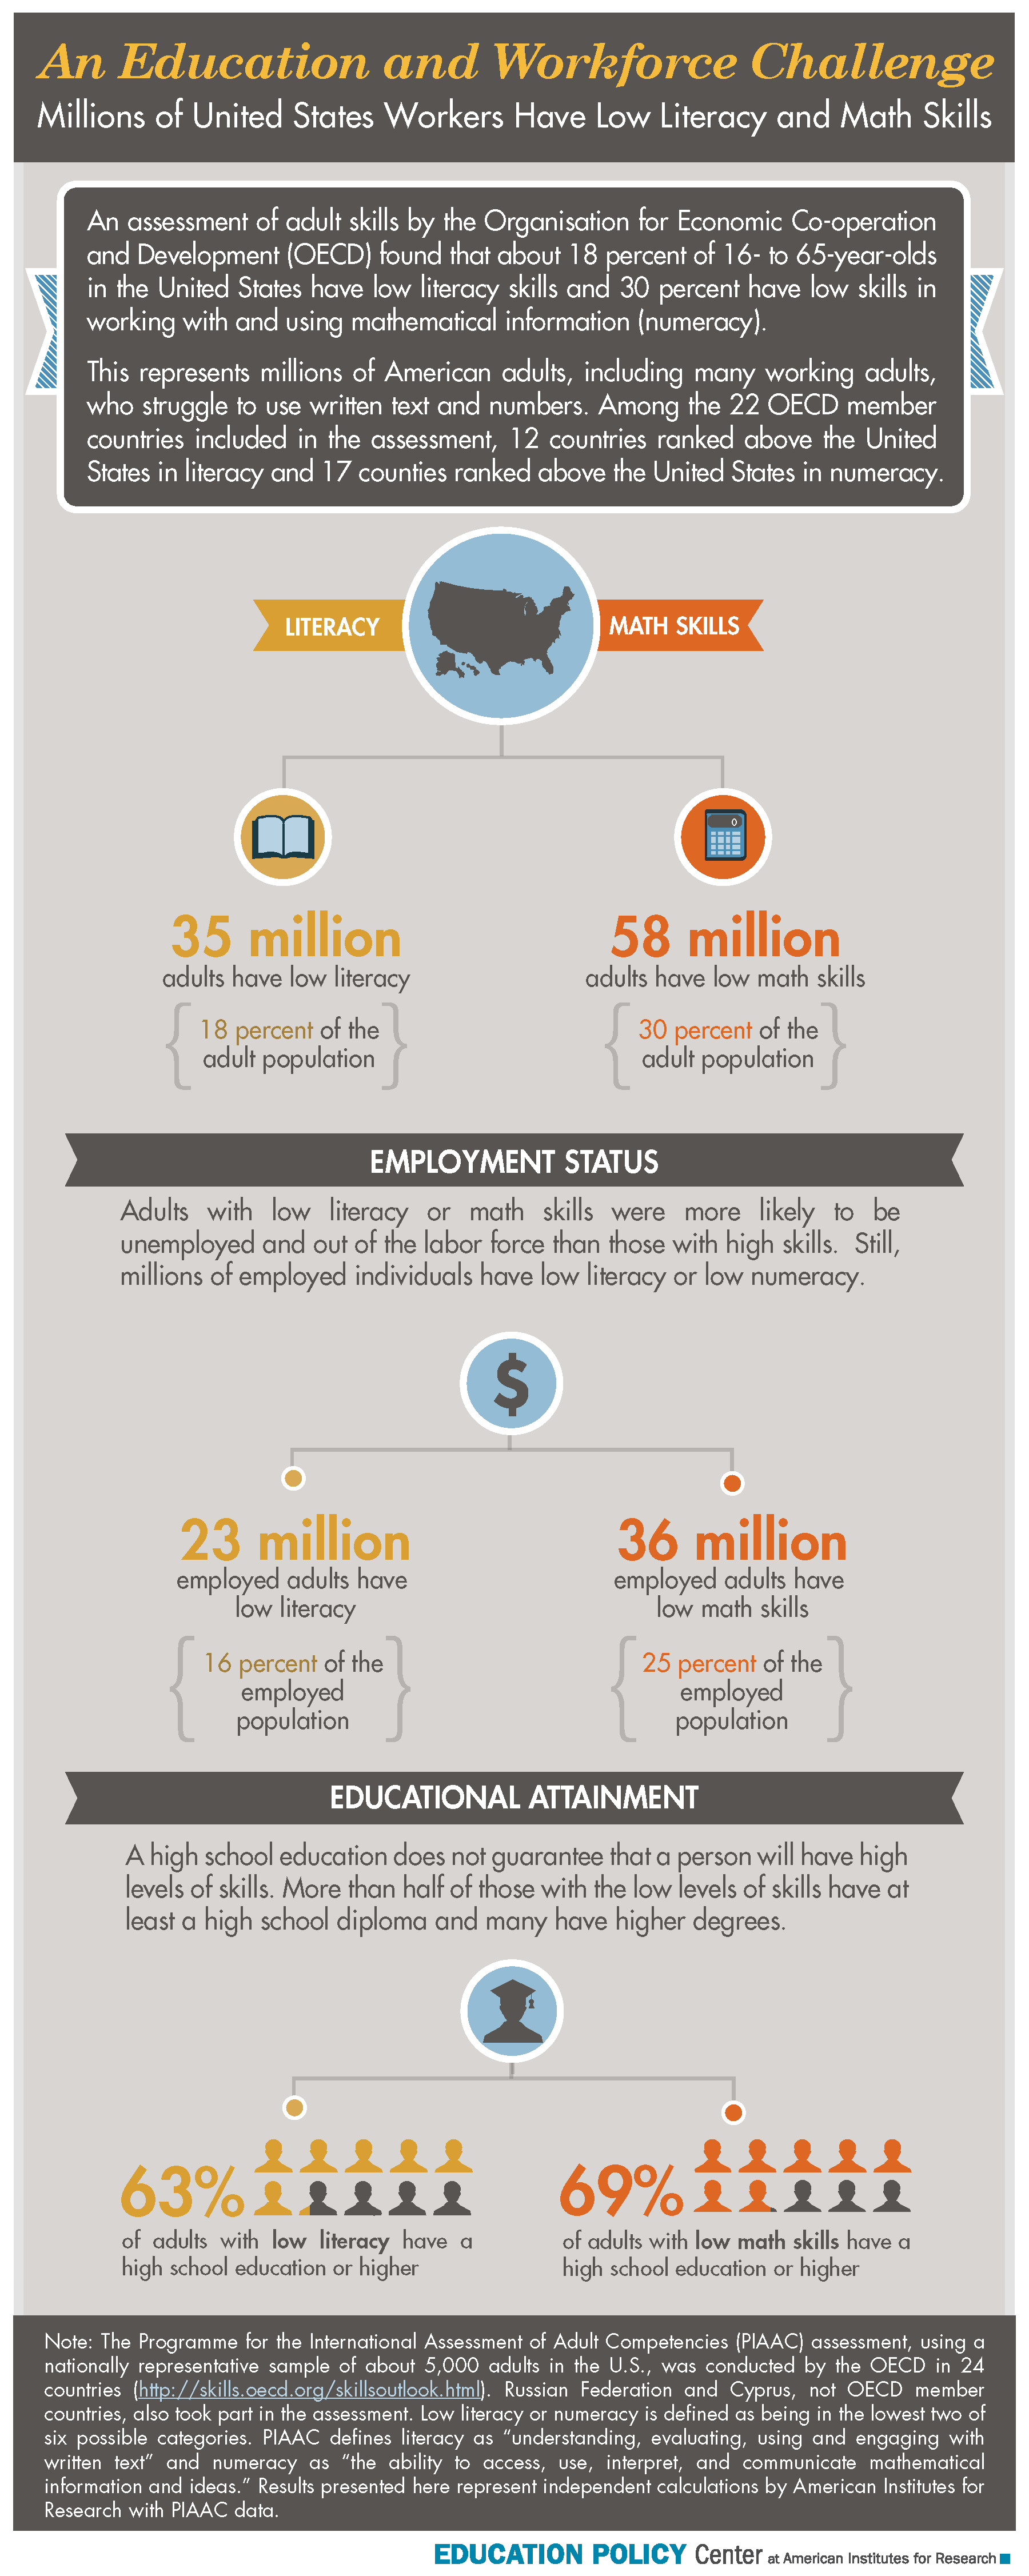
An Education and Workforce Challenge
This infographic, prepared by the Education Policy Center at the American Institutes for Research, shows the literacy/numeracy skill levels of U.S. adults and how being employed and educated does not guarantee a higher level of skills.
Created with U.S. PIAAC 2012/2014 data.
View as PDF ›
View as image file ›

Adults, Computers and Problem Solving: What's the Problem?
This infographic, based on a report prepared by the OECD, focuses on adults' problem-solving skills using digital devices.
Created with international PIAAC 2012 data.
View as PDF ›
Download images (ZIP file) ›
For the full report, please click here.
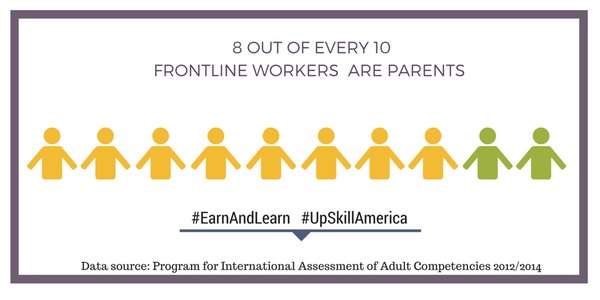
Upskill Infographic on Frontline Workers
This infographic, prepared by the U.S. Department of Education's Office of Career, Technical, and Adult Education (OCTAE), shows that 8 out of every 10 frontline workers in the United States are parents.
Created with U.S. PIAAC 2012/2014 data.
View as image file ›
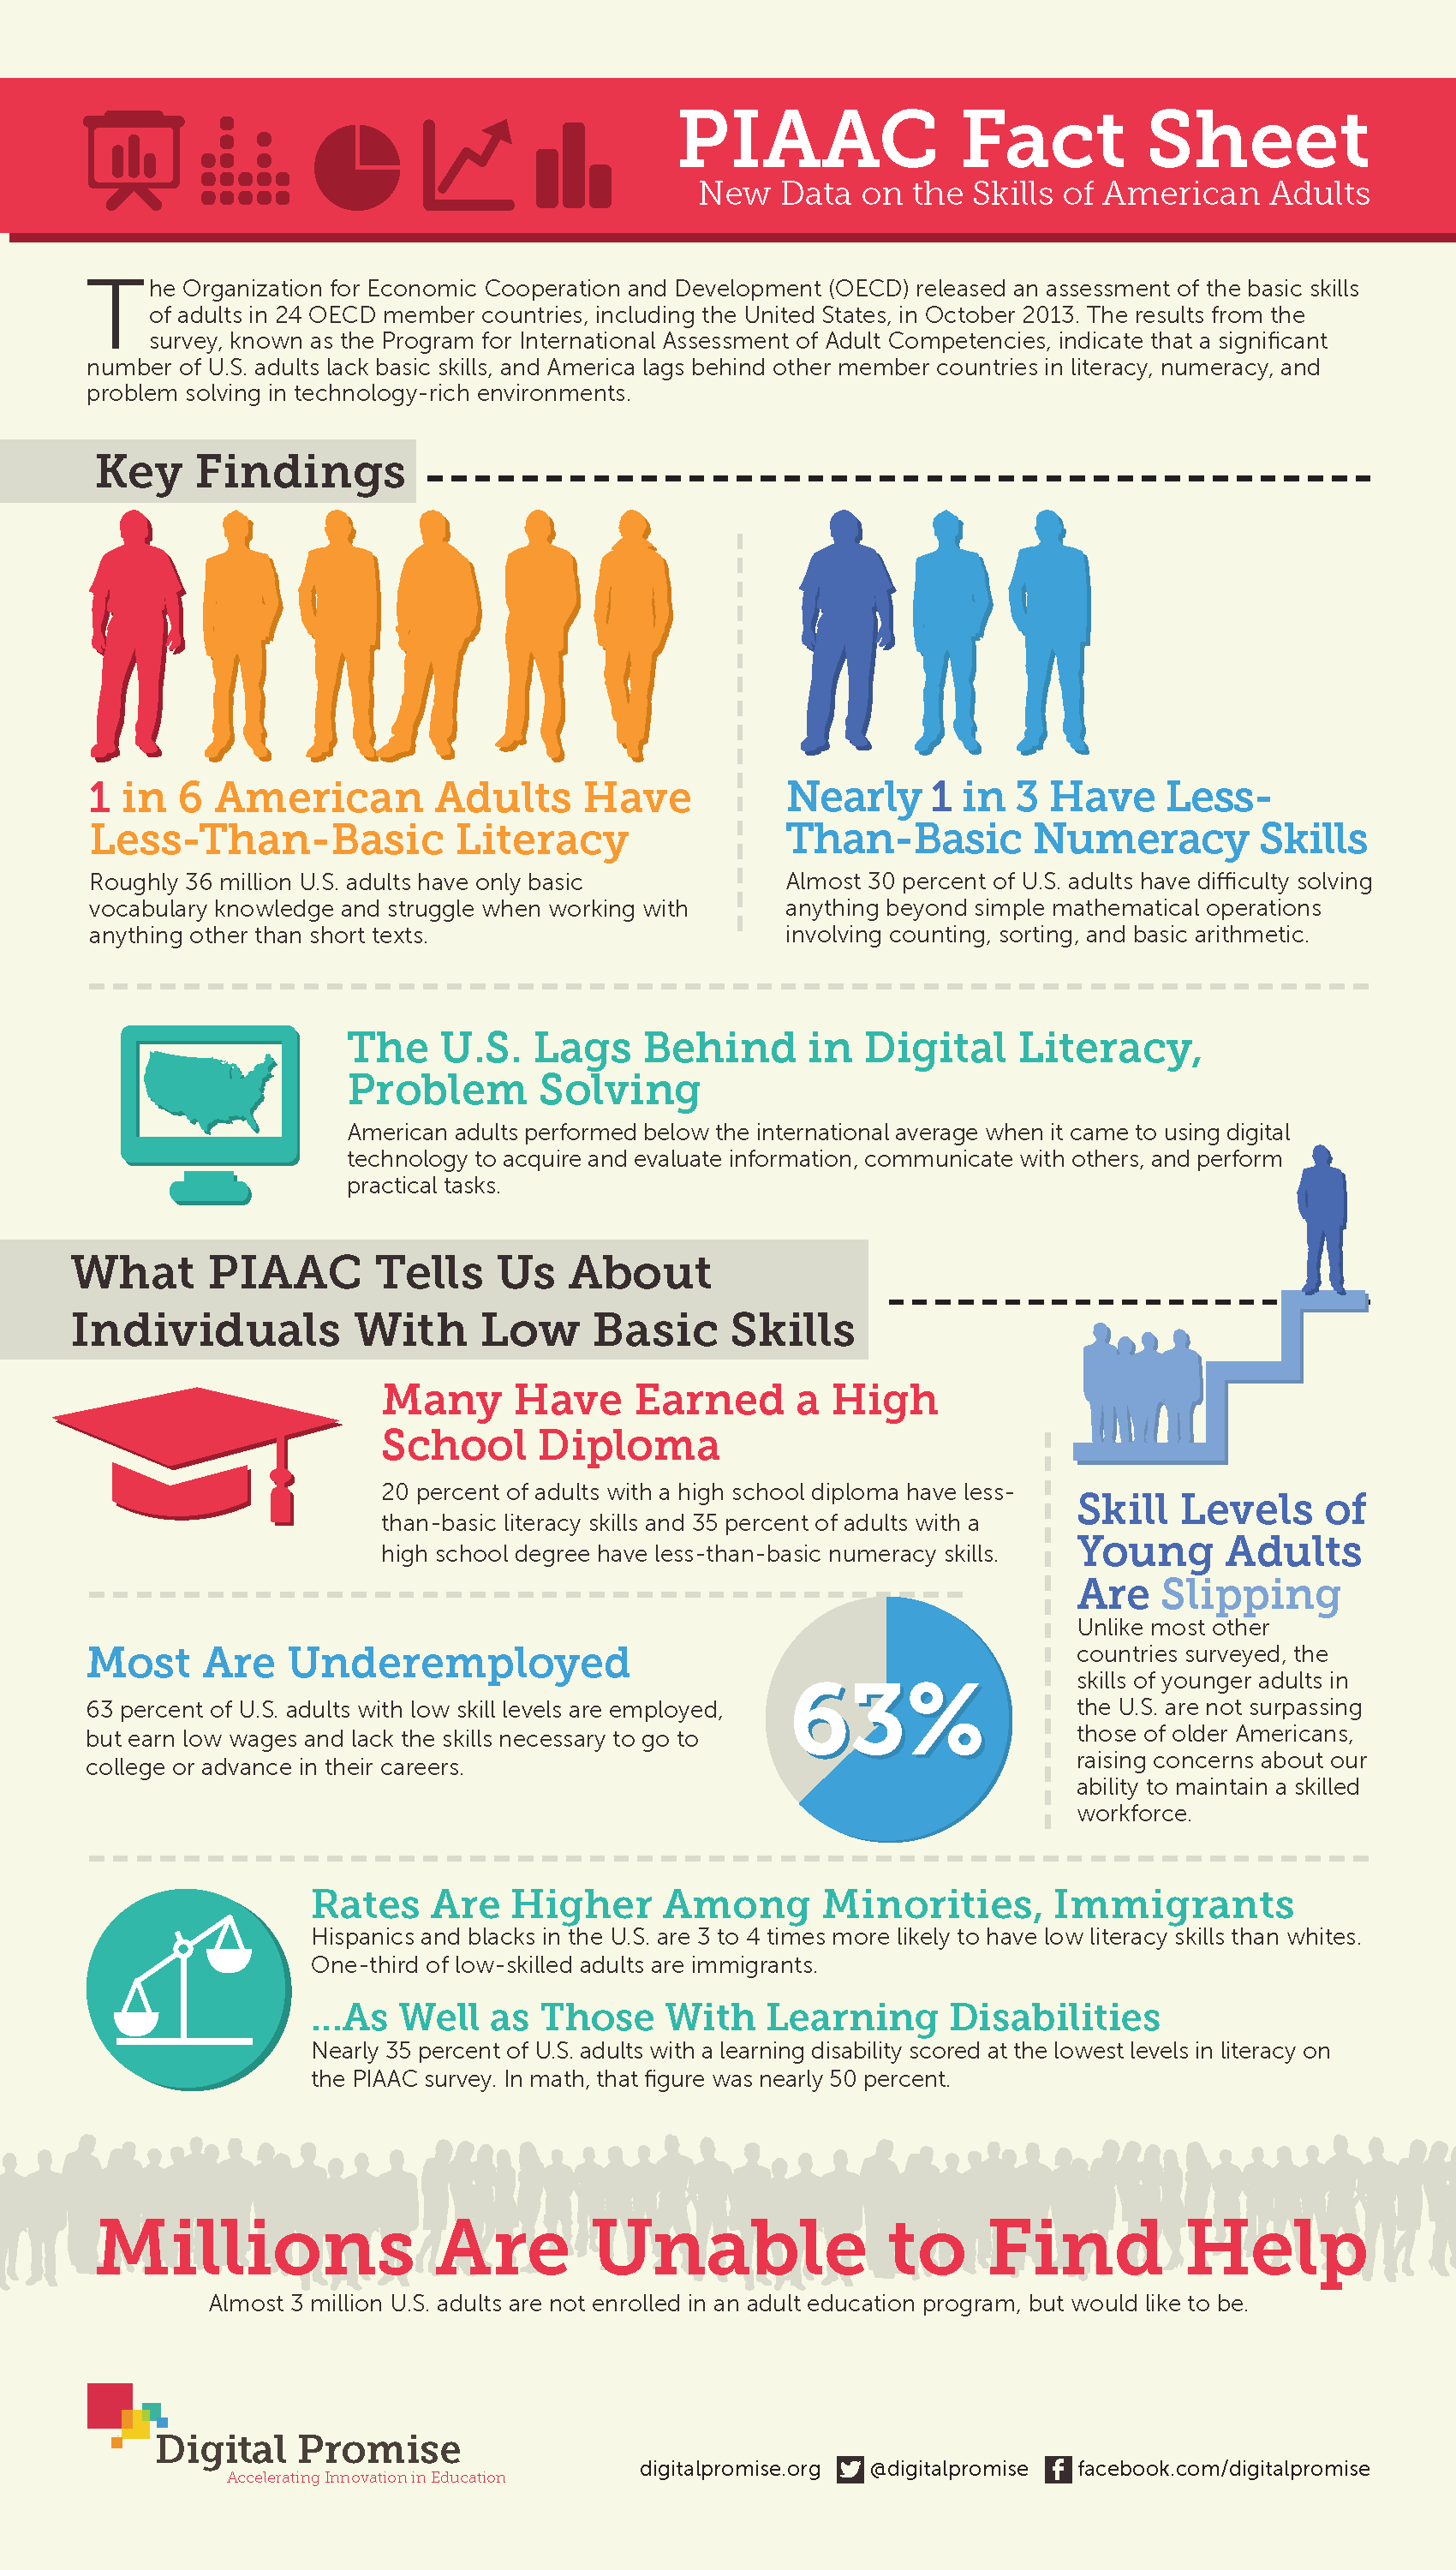
PIAAC Fact Sheet: New Data on the Skills of American Adults
This infographic, prepared by Digital Promise, shows that tens of millions of U.S. adults lack the basic skills needed to succeed in a global 21st-century economy.
Created with U.S. PIAAC 2012 data.
View as PDF ›
View as image file ›
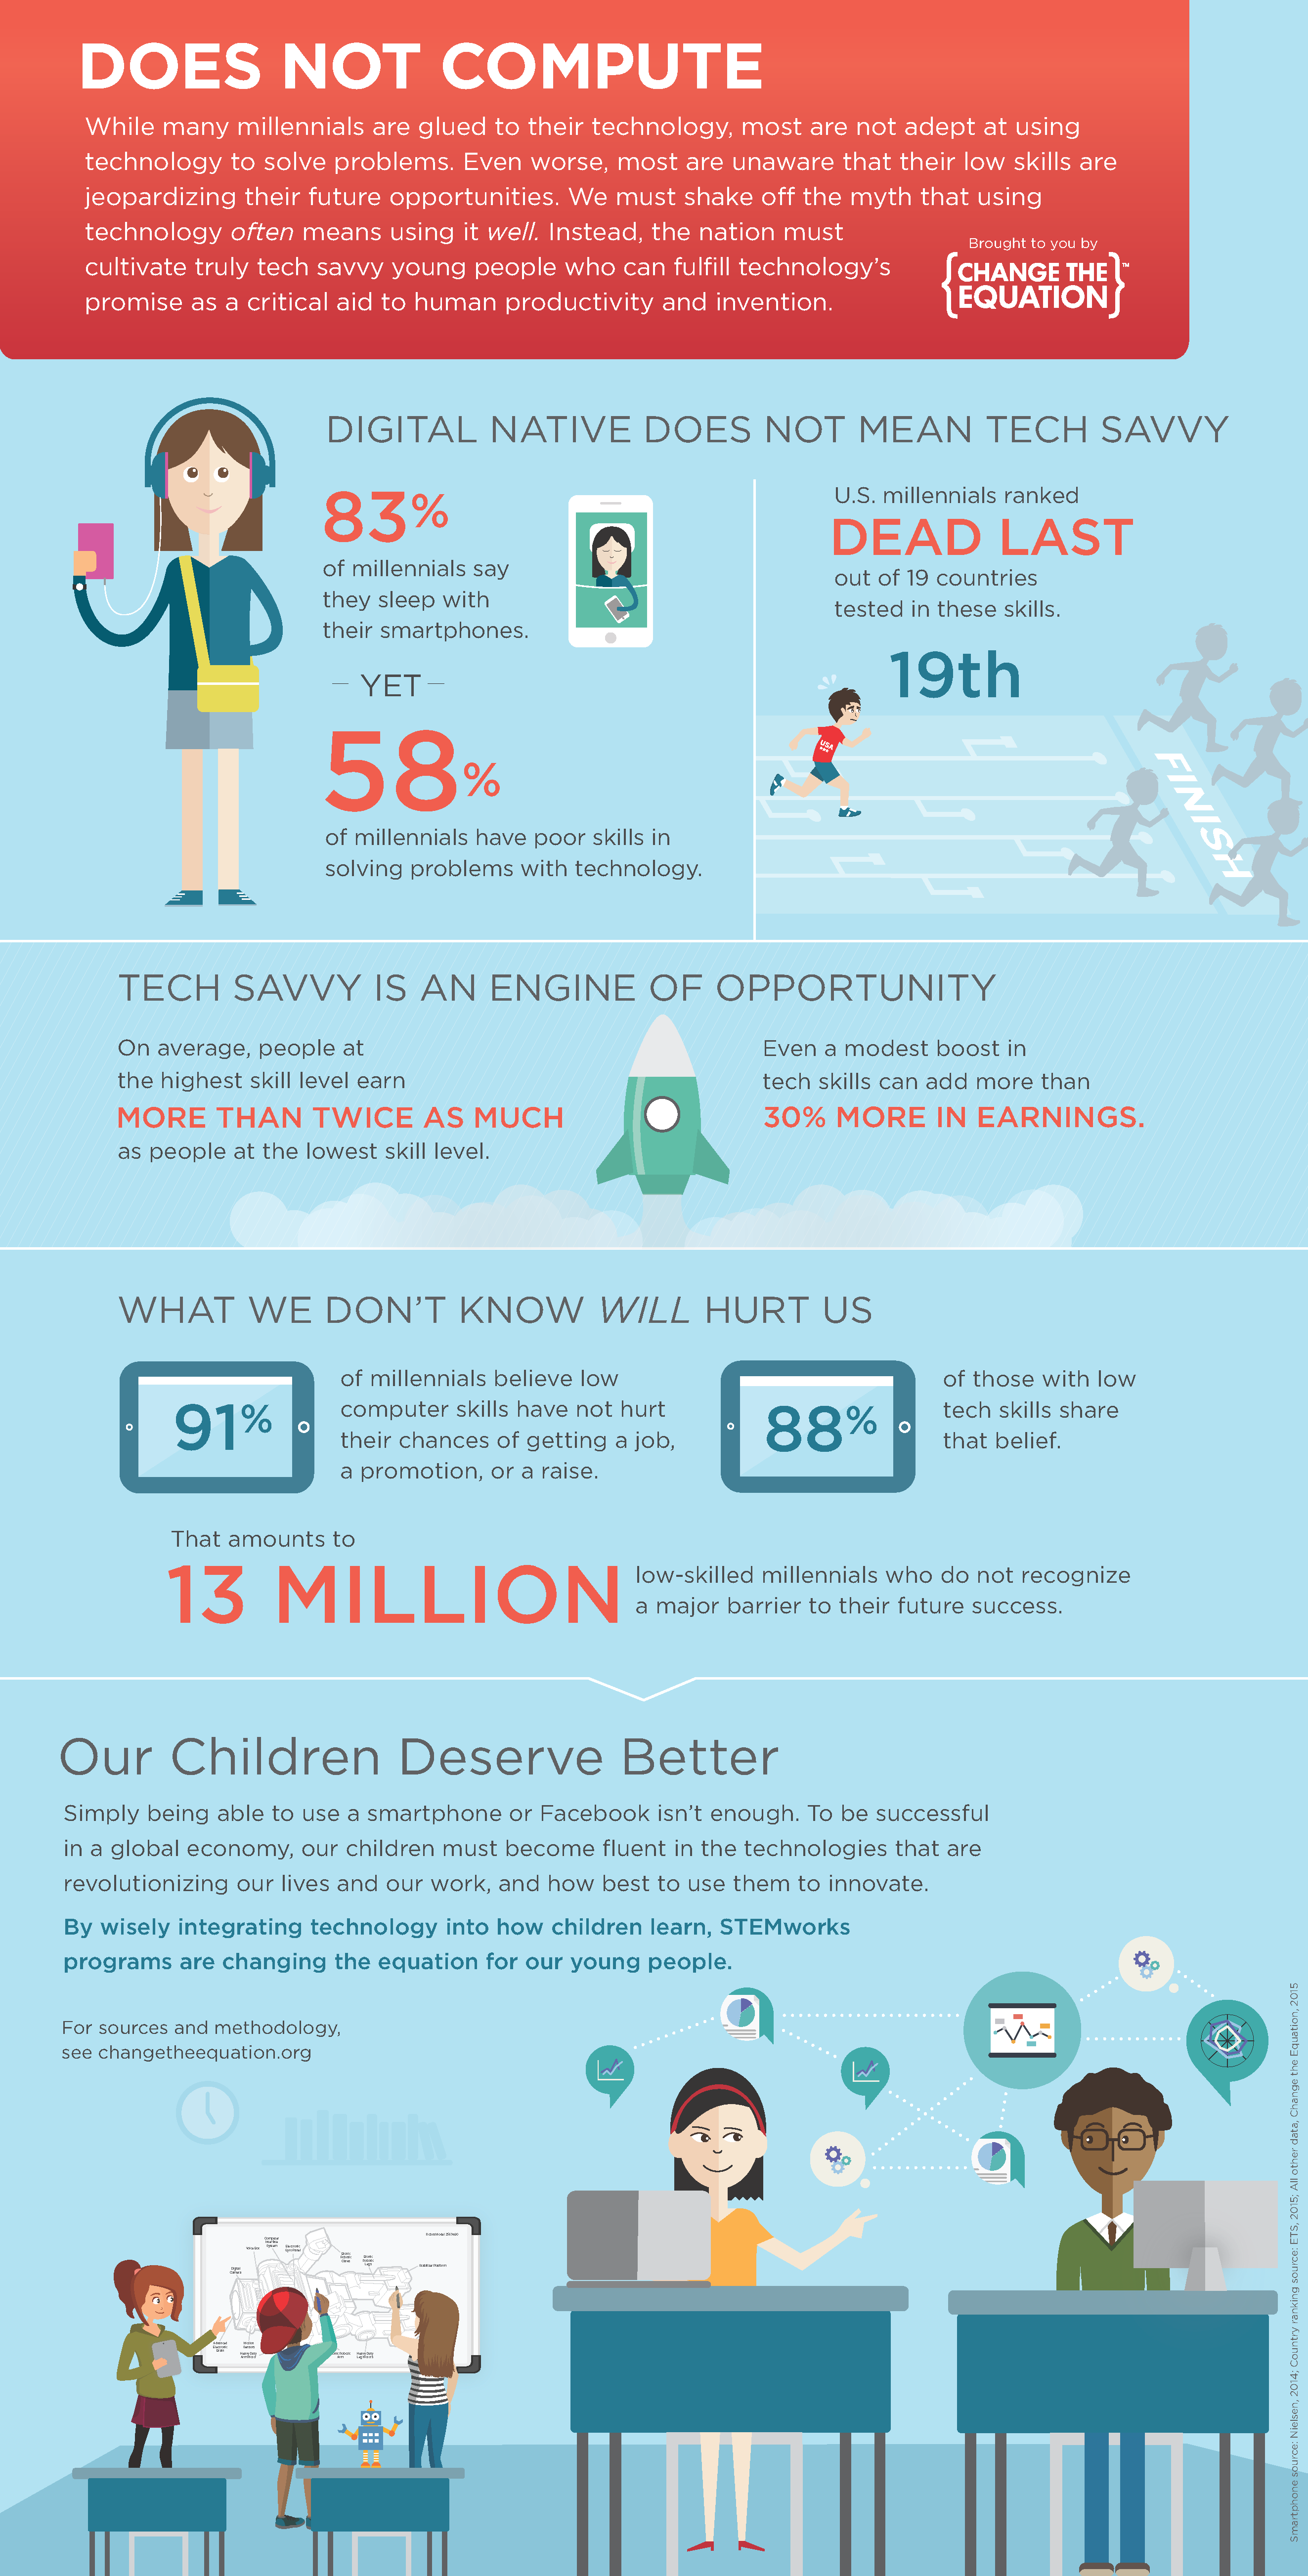
Does Not Compute
This infographic, developed by Change the Equation, reveals sobering new data on the skills and attitudes of U.S. millennials. What millennials don't know about their tech skills is costing them dearly.
Created with U.S. PIAAC 2012 data.
View as PDF ›
View as image file ›
The PIAAC Outreach Toolkit is designed to make it easy for you to access and share PIAAC results. It contains handouts, infographics, and a selection of slide modules that you can use to create customized presentations on PIAAC that focus on the issues that are most salient to partners and leaders in your community.
Want help thinking about how to put together materials for a specific audience? Just email us at piaac@air.org and one of our team members will get back to you.
View the PIAAC Outreach Toolkit Brochure ›